


5-24
K RECUR
(V-WIN)?UEU@UA\
@DUEDUDU)
(TYPE)(
a
n
+1
)A(a
n
)@U
(SET)(a
1
)@UEU@U)
(SEL+S)D( ))
(TABL)
(G
• CON)
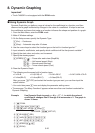
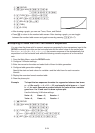
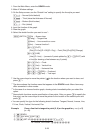
• After drawing a graph, you can use Trace, Zoom, and Sketch.
• Press to return to the number table screen. After drawing a graph, you can toggle
between the number table screen and graph screen by pressing (GjT).
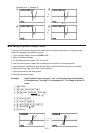
I Graphing a Phase Plot from Two Numeric Sequences
You can draw the phase plot for numeric sequences generated by two expressions input in the
RECUR mode with one value on the horizontal axis and the other value on the vertical axis.
For a
n
(a
n
+1
, a
n
+2
), b
n
(b
n
+1
, b
n
+2
), c
n
(c
n
+1
, c
n
+2
), the numeric sequence of the alphabetically first
expression is on the horizontal axis while the following numeric sequence is on the vertical
axis.
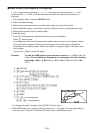
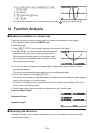
1. From the Main Menu, enter the RECUR mode.
2. Configure V-Window settings.
3. Enter two recursion formulas and select both of them for table generation.
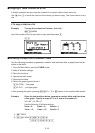
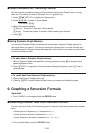
4. Configure table generation settings.
Specify the start and end values for variable
n and the initial term for each recursion
formula.
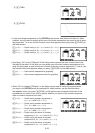
5. Display the recursion formula number table.
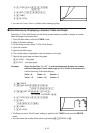
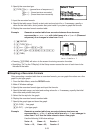
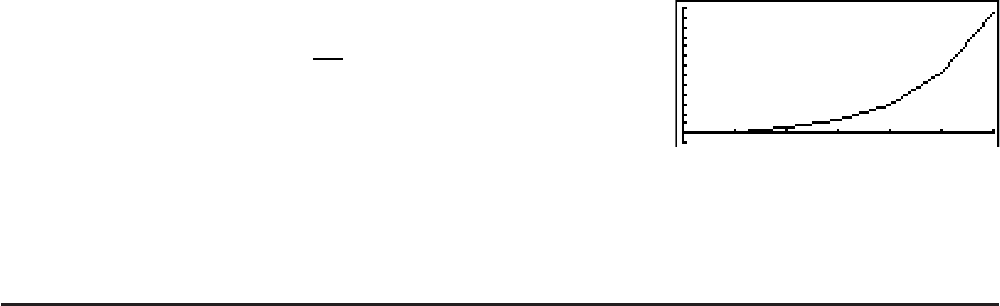
6. Draw the phase plot.
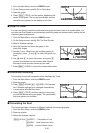
Example To input the two sequence formulas for regression between two terms
a
n
+1
= 0.9a
n
and b
n
+1
= b
n
+ 0.1
n
− 0.2, and specify initial terms a
1
= 1 and
b
1
= 1 for each. Generate a number table as the value of the n variable
goes from 1 to 10 and use it to draw a phase plot.
Use the following V-Window settings.
Xmin = 0, Xmax = 2, Xscale = 1
Ymin = 0, Ymax = 4, Yscale = 1
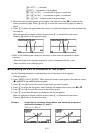
K RECUR
(V-WIN)?UAU@UA
?UCU@U)
(TYPE)(
a
n
+1
)?H(a
n
)U
(n.a
n
··)(b
n
)?@(n)?AU
(SET)(a
1
)@U@?U@U@U)