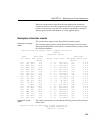
Monitoring the buffer caches
468
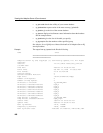
PRIVATE starts monitoring of the temp buffer cache, for the Temporary Store
of the database you are connected to. You need to issue a separate command to
monitor each buffer cache.
dummy_table_name can be any IQ table. However, it’s a good idea to create a
table that you use only for monitoring. The table name is required for syntactic
compatibility with other
IQ UTILITIES commands. No matter what table name
you specify, you are monitoring buffer caching for all tables in a database.
’monitor_options’ can include one or more of the following values:
•
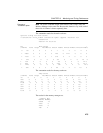
-summary displays summary information for both the main and temp
buffer caches. If you do not specify any monitor options, you receive a
summary report. The fields displayed are as described for the other
options, plus the following:
• Users: Number of users connected to the buffer cache
• IO: Combined physical reads and writes by the buffer cache
•
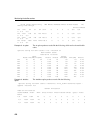
-cache displays activity in detail for the main or temp buffer cache. The
fields displayed are:
• Finds: Find requests to the buffer cache
• Creats: Requests to create a page within the database
• Dests: Requests to destroy a page within the database
• Dirty: Number of times the buffer was dirtied (modified)
• HR%: Percentage of above satisfied by the buffer cache without
requesting any I/O
• BWaits: Find requests forced to wait for a busy page (page frame
contention)
• ReReads: Number of times the same portion of the store needed to be
reread into the cache within the same transaction
• FMiss: False misses, number of times the buffer cache needed
multiple lookups to find a page in memory. This number should be 0
or very small. If the value is high, it is likely that a rollback occurred,
and certain operations needed to be repeated
• Cloned: Number of buffers that Adaptive Server IQ needed to make a
new version for a writer, while it had to retain the previous version for
concurrent readers


