


CHAPTER 13 Monitoring and Tuning Performance
477
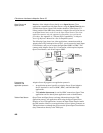
Buffer manager thrashing occurs when the operating system chooses less
optimum buffers to page out to disk, which forces the buffer manager to make
extra reads from disk to bring those buffers back to memory. Since Adaptive
Server IQ knows which buffers are the best candidates to flush out to disk, you
want to avoid this operating system interference by reducing the overall
number of page outs.
When you set buffer sizes, keep in mind the following trade-off:
• If the IQ buffer cache is too large, the operating system is forced to page
as Adaptive Server IQ tries to use all of that memory.
• If the IQ buffer cache is too small, then Adaptive Server IQ thrashes
because it cannot fit enough of the query data into the cache.
If you are experiencing dramatic performance problems, you should monitor
paging to determine if thrashing is a problem. If so, then reset your buffer sizes
as described in “Managing buffer caches”.
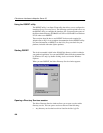
Monitoring paging on Windows NT systems
Windows NT provides the NT Performance Monitor to help you monitor
paging. To access it, select the object Logical Disk, the instance of the disk
containing the file PAGEFILE.SYS, and the counter Disk Transfers/Sec. This
should be on a separate disk from your database files. You can also monitor the
Object Memory and the counter Pages/Sec. However, this value is the sum of
all memory faults which includes both soft and hard faults.
Monitoring paging on UNIX systems
UNIX provides a system command, vmstat, to help you monitor system activity
such as paging. The abbreviated command syntax is:
vmstat
interval
count
The interval is the time between rows of output, and count is the number times
a row of output is displayed. For more information about
vmstat (including its
options and field descriptions), see your operating system's documentation.
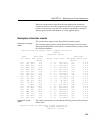
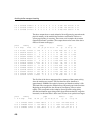
Here is an example:
> vmstat 2 3
procs memory page disk faults cpu
r b w swap free re mf pi po fr de sr s0 s1 sd in sy cs us sy id