


CHAPTER 13 Monitoring and Tuning Performance
479
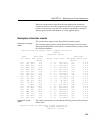
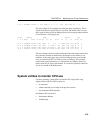
19 0 0 3246612 26748 0 273 1248 0 0 0 0 950 394 1180 92 7 0
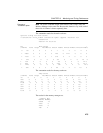
The above output is from slightly later when the query is underway. This is
evident from the user mode CPU level (us field). The buffer cache is not yet
full as page-in faults (pi field or KB paged in) are still occurring and the amount
of free memory is still going down.
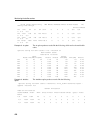
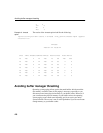
procs memory page faults cpu
r b w swap free re mf pi po fr de sr in sy cs us sy id
21 0 0 3246608 22100 0 201 1600 0 0 0 0 1208 1257 1413 88 12 0
18 0 0 3246608 17196 0 370 1520 0 464 0 139 988 209 1155 91 8 0
11 0 0 3251116 16664 0 483 2064 138 2408 0 760 1315 218 1488 88 12 0
30 0 0 3251112 15764 0 475 2480 310 4450 0 1432 1498 199 1717 87 13 0
The above output is from even later. On the third line of the output it shows that
the system has reached its threshold for the amount of free memory it can
maintain. At this point, page-outs (po field or KB paged out) occur and the
level of system mode CPU (sy field) increases accordingly. This situation
results because physical memory is overallocated: the Adaptive Server IQ
buffer caches are too big for the machine. To resolve this problem, reduce the
size of one or both of the buffer caches.
System utilities to monitor CPU use
Use these operating system utilities to monitor CPU usage while using
Adaptive Server IQ. On UNIX systems use:
•
ps command
•
vmstat command (see example in the previous section)
•
sar command (UNIX SystemV)
On Windows NT systems use:
• Performance Monitor
• Task Manager