Monitoring the buffer caches
472
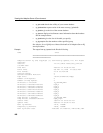
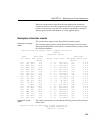
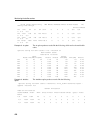
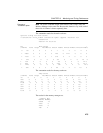
• -debug is used mainly to supply information to Sybase Technical Support.
It displays all the information available to the performance monitor,
whether or not there is a standard display mode that covers the same
information. The top of the page is an array of statistics broken down by
disk block type. This is followed by other buffer cache statistics, memory
manager statistics, thread manager statistics, free list statistics, CPU
utilization, and finally buffer allocator statistics. The buffer allocator
statistics are then broken down by client type (hash, sort, and so on) and a
histogram of the most recent buffer allocations is displayed.
Note The interval, with two exceptions, applies to each line of output, not to
each page. The exceptions are
-cache_by_type and -debug, where a new page
begins for each display.
Stopping the buffer cache monitor
The command you use to stop a monitor run is similar to the one you use to
start it, except that you do not need to specify any options. Use this syntax to
stop the IQ buffer cache monitor:
IQ UTILITIES { MAIN | PRIVATE }
INTO
dummy_table_name
STOP MONITOR
Examining and saving monitor results
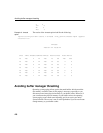
The monitor stores results in an ordinary text file. This file defaults to:
• dbname.connection#-main-iqmon for main buffer cache results
• dbname.connection#-temp-iqmon for temp buffer cache results
The prefix dbname.connection# represents your database name and
connection number. If you see more than one connection number and are
uncertain which is yours, you can run the Catalog stored procedure
sa_conn_info. This procedure displays the connection number, user ID, and
other information for each active connection to the database.
You can use the
-file_suffix parameter on the IQ UTILITIES command to change
the suffix iqmon to a suffix of your choice.
To see the results of a monitor run, use a text editor or any other method you
would normally use to display or print a file.


