CHAPTER 13 Monitoring and Tuning Performance
469
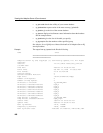
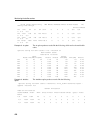
• Reads/Writes: Physical reads and writes performed by the buffer
cache
• PF/PFRead: Prefetch requests and reads done for prefetch
• GDirty: Number of times the LRU buffer was grabbed dirty and
Adaptive Server IQ had to write it out before using it
• Pin%: Percentage of pages in the buffer cache in use and locked
• Dirty%: Percentage of buffer blocks that were modified
•
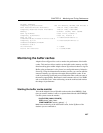
-cache_by_type produces the same results as -cache, but broken down by
IQ page type. (An exception is the Bwaits column, which shows a total
only.) This format is most useful when you need to supply information to
Sybase Technical Support.
•
-file_suffix suffix creates a monitor output file named
<dbname>.<connid>-<main_or_temp>-<suffix>. If you do not
specify a suffix, it defaults to iqmon.
•
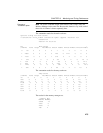
-io displays main or temp (private) buffer cache I/O rates and compression
ratios. The fields displayed are:
• Reads: Physical reads performed by the buffer cache
• Lrd(KB): Logical kilobytes read in
• Prd(KB): Physical kilobytes read in
• Rratio: Compression ratio of logical to physical data read in
• Writes: Physical writes performed by the buffer cache
• Lwrt(KB): Logical kilobytes written
• Pwrt(KB): Physical kilobytes written
• Wratio: Compression ratio of logical to physical data written
•
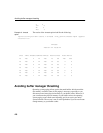
-bufalloc displays information on the main or temp buffer allocator, which
reserves space in the buffer cache for objects like sorts, hashes, and
bitmaps.
• OU: OptimizeForThisManyUsers option setting
• AU: Current number of active users
• MaxBuf: Number buffers under control of the buffer allocator
• Avail: Number of currently available buffers for pin quota allocation


