


3 – Managing Fabrics
Event Browser
3-6 59234-03 A
S
3.5.1
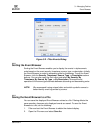
Filtering the Event Browser
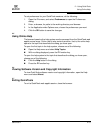
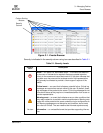
Filtering the Event Browser enables you to display only those events that are of
interest based on the event severity, timestamp, source, type, and description. To
filter the Event Browser, open the Filter menu and select Filter Entries. This
opens the Filter Events dialog shown in Figure 3-2. The Event Browser displays
those events that meet all of the criteria in the Filter Events dialog. If the filtering
criteria is cleared or changed, then all the events that were previously hidden that
satisfy the new criteria will be shown.
You can filter the event browser in the following ways:
Severity —
select one or more of the corresponding options to display alarm
events, critical events, warning events, or informative events.
Date/Time —
select one or both of the From: and To: options. Enter the
bounding timestamps (MM/dd/yy hh:mm:ss aa) to display only those events
that fall within those times. ("aa" indicates AM or PM.) The current year (yy)
can be entered as either 2 or 4 digits. For example, 12/12/03 will be
interpreted December 12, 2003.
Tex t —
select one or more of the corresponding options and enter a text
string (case sensitive) for event source, type, and description. The Event
Browser displays only those events that satisfy all of the search
specifications for the Source, Type, and Description text.
NOTE: Events (Alarms, Critical, Warning, and Informative) generated by
the web applet are not saved on the switch. They are permanently
discarded when you close a QuickTools session, but you can save
these events to a file on the workstation before you close
QuickTools and read it later with a text editor or browser.
Events generated by the switch are stored on the switch, and will
be retrieved when the web applet is restarted. Some alarms are
configurable.