


20050401
5-2 Controlling What Appears on a Graph Screen
kk
kk
k V-Window (View Window) Settings
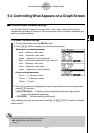
Use the View Window to specify the range of the x- and y-axes, and to set the spacing
between the increments on each axis. You should always set the V-Window parameters you
want to use before graphing.
u To make V-Window settings
1. From the Main Menu, enter the GRAPH mode.
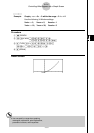
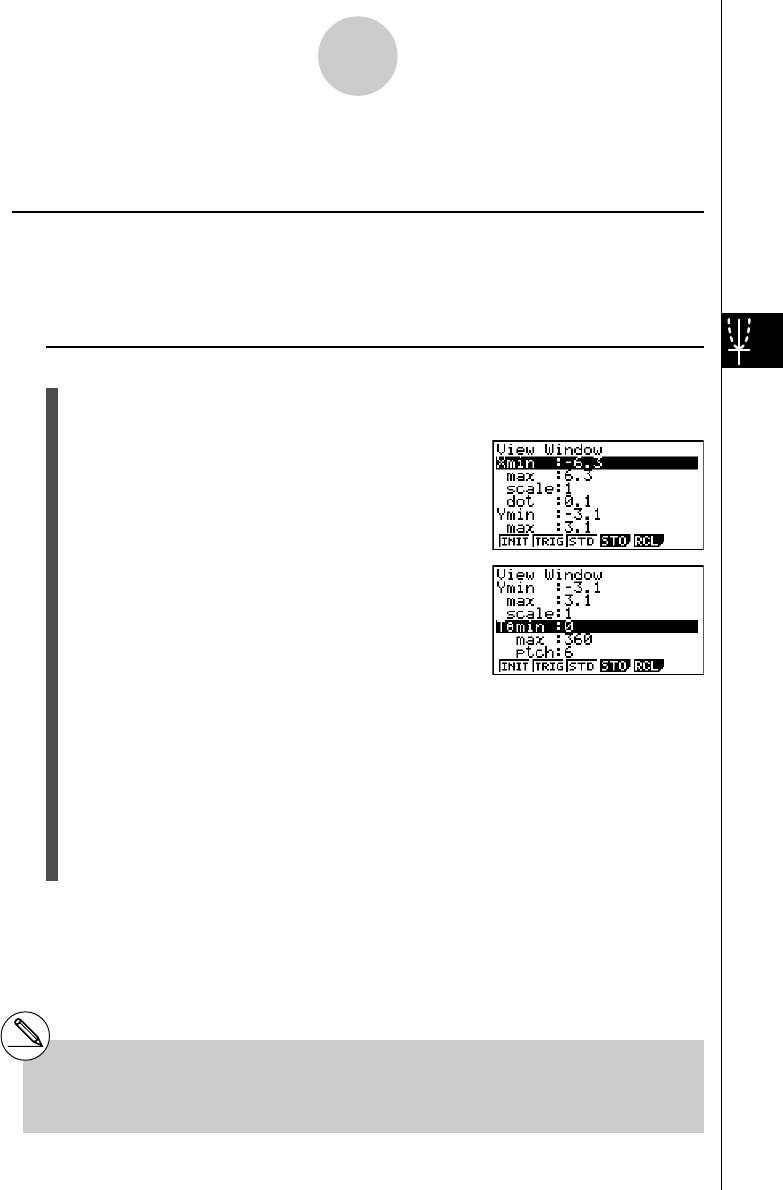
2. Press !3(V-WIN) to display the V-Window setting screen.
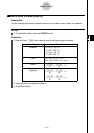
Rectangular coordinate parameter
Xmin … Minimum x-axis value
Xmax … Maximum x-axis value
Xscale … Spacing of x-axis increments
Xdot … Value that corresponds to one x-axis dot
Ymin … Minimum y-axis value
Ymax … Maximum y-axis value
Yscale … Spacing of y-axis increments
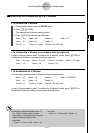
Polar coordinate parameter
T
θ
min ... T,
θ
minimum values
T
θ
max ... T,
θ
maximum values
T
θ
ptch ... T,
θ
pitch
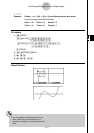
3. Press c to move the highlighting and input an appropriate value for each parameter,
pressing w after each.
• {INIT}/{TRIG}/{STD} … V-Window {initial settings}/{initial settings using specified
angle unit}/{standardized settings}
•{STO}/{RCL} … V-Window setting {store}/{recall}
After settings are the way you want them, press J or !J(QUIT) to exit the V-Window
setting screen.*
1
5-2-1
Controlling What Appears on a Graph Screen
*
1
Pressing w without inputting anything while
k is displayed exits the V-Window setting
screen.