


20050401
kk
kk
k Conic Section Graph Analysis
You can determine approximations of the following analytical results using conic section
graphs.
• Focus/vertex/eccentricity
• Length of latus rectum
• Center/radius
• x-/y-intercept
•Directrix/axis of symmetry drawing and analysis
•Asymptote drawing and analysis
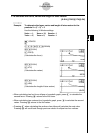
1. From the Main Menu, enter the CONICS mode.
2. Use f and c to select the conic section you want to analyze.
3. Input the conic section constants.
4. Draw the Graph.
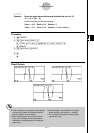
After graphing a conic section, press !5(G-SLV) to display the following graph analysis
menus.
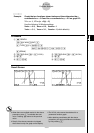
u Parabolic Graph Analysis
• {FOCS}/{VTX}/{LEN}/{e} ... {focus}/{vertex}/{length of latus rectum}/{eccentricity}
• {DIR}/{SYM} ... {directrix}/{axis of symmetry}
• {X-IN}/{Y-IN} ... {x-intercept}/{y-intercept}
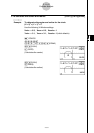
u Circular Graph Analysis
• {CNTR}/{RADS} ... {center}/{radius}
• {X-IN}/{Y-IN} ... {x-intercept}/{y-intercept}
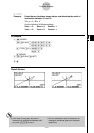
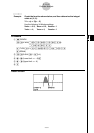
u Elliptical Graph Analysis
• {FOCS}/{VTX}/{CNTR}/{e} ... {focus}/{vertex}/{center}/{eccentricity}
• {X-IN}/{Y-IN} ... {x-intercept}/{y-intercept}
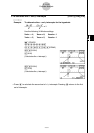
u Hyperbolic Graph Analysis
• {FOCS}/{VTX}/{CNTR}/{e} ... {focus}/{vertex}/{center}/{eccentricity}
• {ASYM} ... {asymptote}
• {X-IN}/{Y-IN} ... {x-intercept}/{y-intercept}
The following examples show how to use the above menus with various types of conic
section graphs.
5-11-17
Function Analysis