


20050401
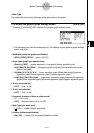
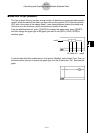
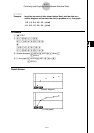
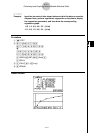
k Displaying the Calculation Results of a Drawn Single-Variable Graph
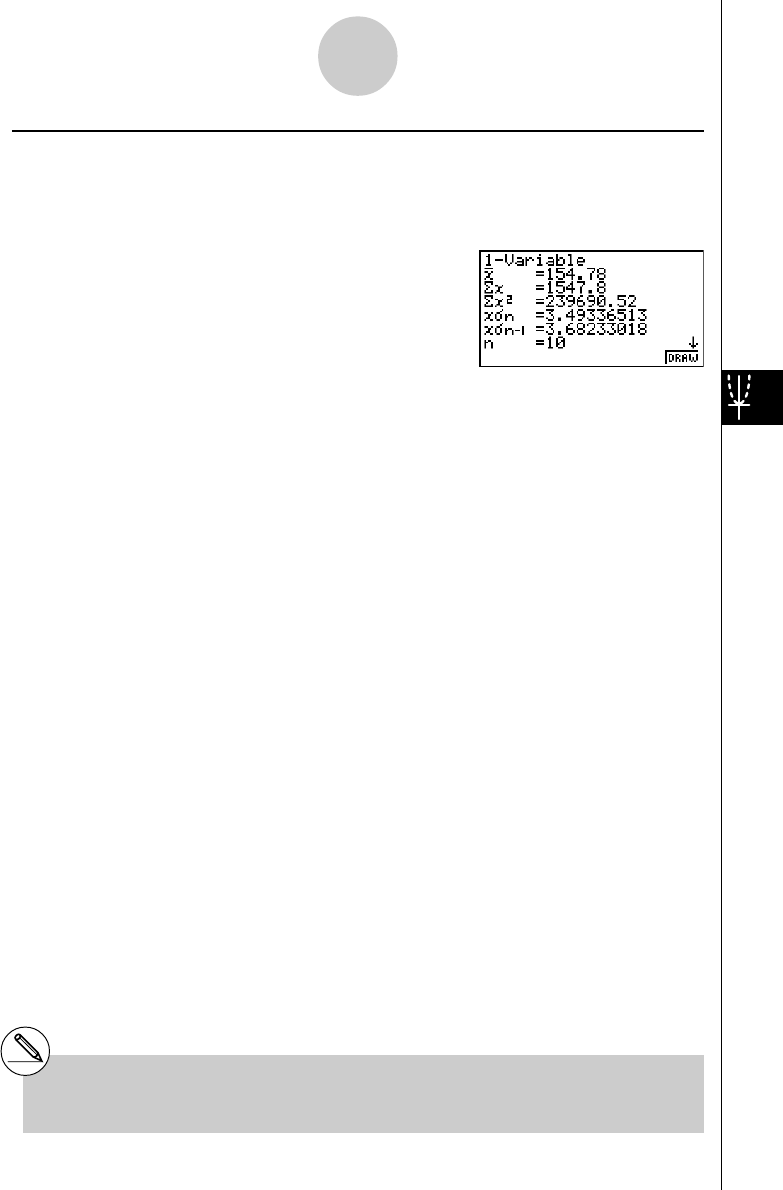
Single-variable statistics can be expressed as both graphs and parameter values. When
these graphs are displayed, the single-variable calculation results appear as shown below
when you press 1(1VAR).
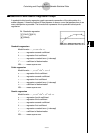
•Use c to scroll the list so you can view the items that run off the bottom of the screen.
The following describes the meaning of each of the parameters.
o ............. mean
Σx ........... sum
Σx
2
.......... sum of squares
xσn .......... population standard deviation
xσn–1 ........ sample standard deviation
n ............. number of data items
minX ....... minimum
Q1 .......... first quartile
Med ........ median
Q3 .......... third quartile
maxX ...... maximum
Mod ........ mode
Mod : n ... number of data mode items
Mod : F ... data mode frequency
•Press 6(DRAW) to return to the original single-variable statistical graph.
6-2-4
Calculating and Graphing Single-Variable Statistical Data
#When Mod has multiple solutions, they are all
displayed.