


20050401
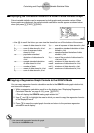
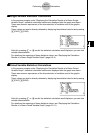
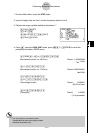
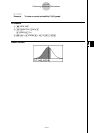
2. Input the value you want for x and then press w.
• This causes the coordinates for x and y to appear at the bottom of the display, and
moves the pointer to the corresponding point on the graph.
3. Pressing v or a number key at this time causes the x-value input dialog box to
reappear so you can perform another estimated value calculation if you want.
4. After you are finished, press J to clear the coordinate values and the pointer from
the display.
• The pointer does not appear if the calculated coordinates are not within the display
range.
• The coordinates do not appear if “Off” is specified for the “Coord” item of the Setup
screen.
• The Y-CAL function can also be used with a graph drawn by using DefG feature.
uu
uu
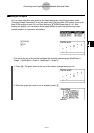
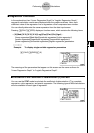
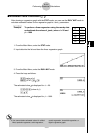
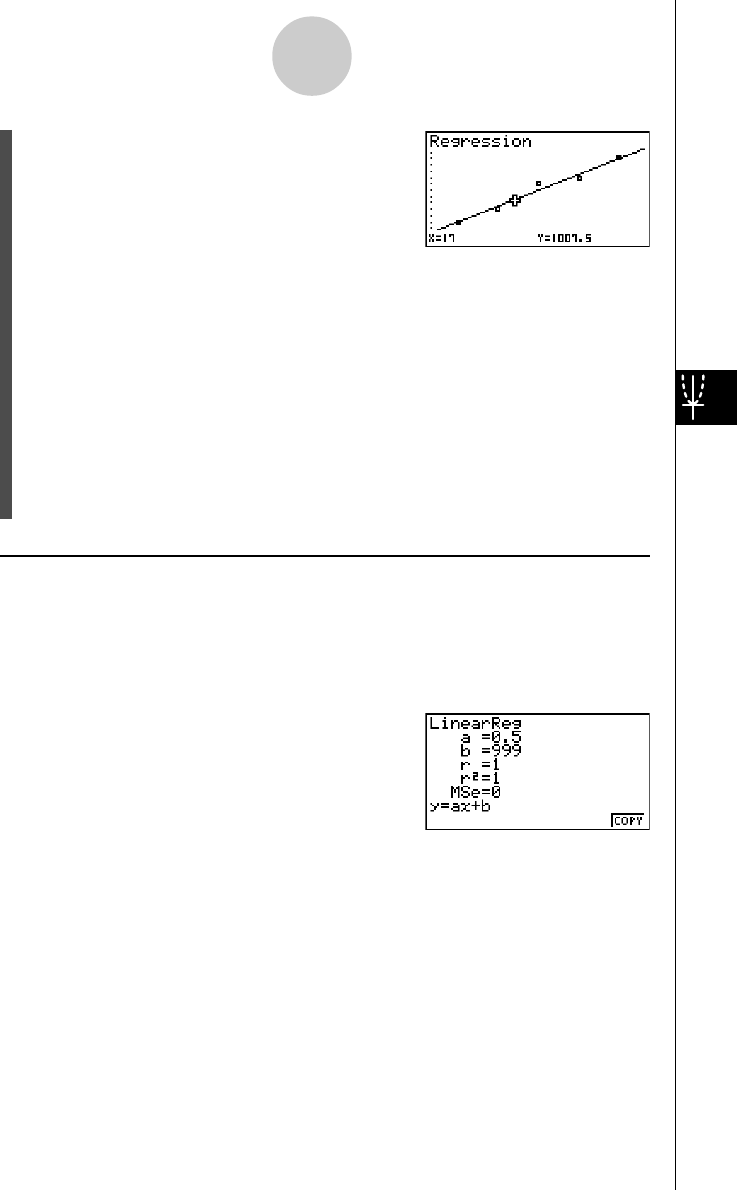
u Regression Formula Copy Function from a Regression Calculation Result
Screen
In addition to the normal regression formula copy function that lets you copy the regression
calculation result screen after drawing a statistical graph (such as Scatter Plot), the STAT
mode also has a function that lets you copy the regression formula obtained as the result of
a regression calculation. To copy a resulting regression formula, press 6(COPY).
6-4-5
Performing Statistical Calculations