


20050401
9-6-1
Statistical Graphs
9-6 Statistical Graphs
This section explains how to graph the data in a spreadsheet.
kk
kk
k Overview
Except for selection of the data to be graphed, the graph operations you can use in the
S
•
SHT mode are basically the same as those in the STAT mode. This section explains the
differences between the S
•
SHT mode graph functions and the STAT mode graph
functions.
kk
kk
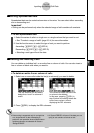
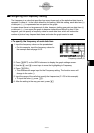
k Using the Graph Menu
Press 6(g)1(GRPH) to display the GRPH submenu.
The functions on the GRPH submenu are the same as those that appear when you press
1(GRPH) in the STAT mode List Editor. The following explains each function and where
you need to go to find out more for them.
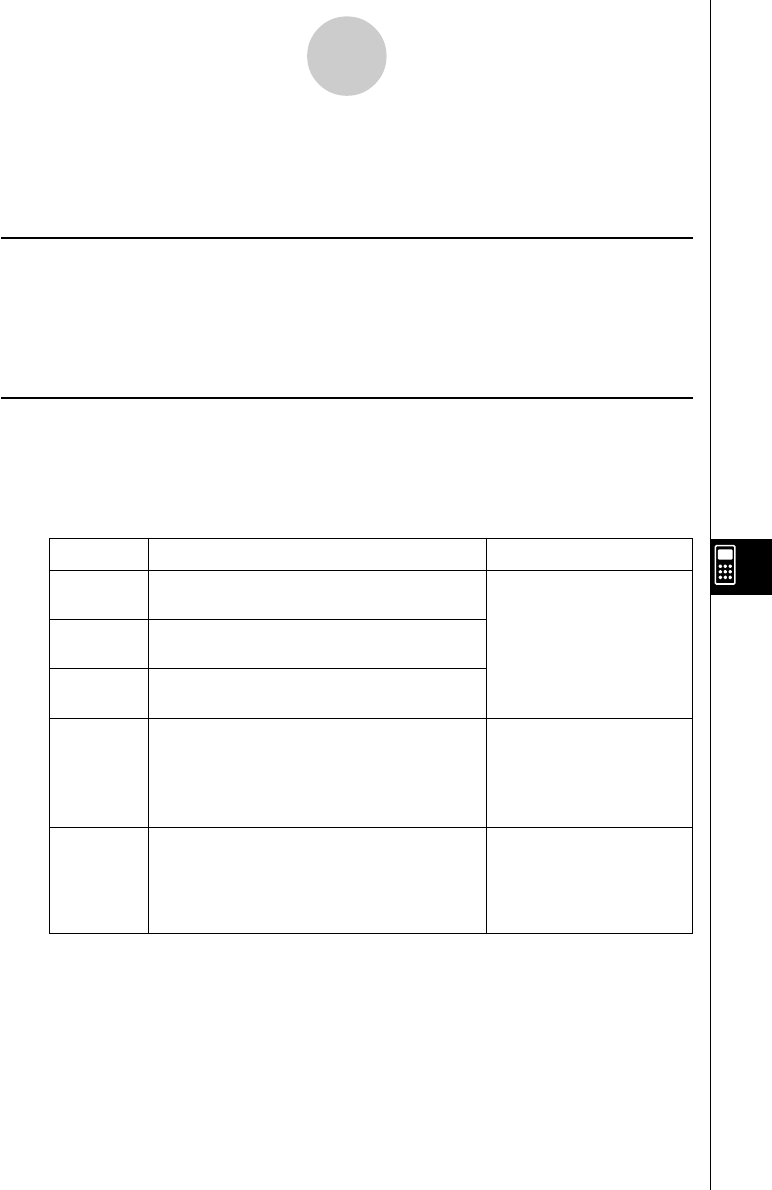
Key Description Go here for more details:
1(GPH1)
2(GPH2)
3(GPH3)
4(SEL)
6(SET)
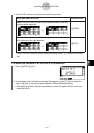
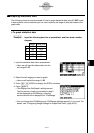
The functions of function menu keys 1 through 4 are basically the same as the STAT
mode function menu. Some of the functions on the menu that appears when you press
6(SET) here are different from those that appear when you press 6(SET) in the STAT
mode. For details about the differences, see “Configuring Graph Parameter Settings” on
page 9-6-2.
Draws a graph in accordance with
StatGraph1 settings (see 6(SET) below).
Draws a graph in accordance with
StatGraph2 settings (see 6(SET) below).
Draws a graph in accordance with
StatGraph3 settings (see 6(SET) below).
Displays a screen for selecting the graph
parameter setup (StatGraph1, StatGraph2,
or StatGraph3). You can also use the screen
to specify simultaneous drawing of multiple
graphs.
Displays a screen for configuring graph
parameter settings (data to be graphed,
graph type, etc.) The setting screen lets you
configure separate settings for StatGraph1,
StatGraph2, and StatGraph3.
"Changing Graph
Parameters" (page 6-1-2)
“Changing Graph
Parameters” (page 6-1-2)
“2. Graph draw/non-draw
status” (page 6-1-4)
“1. General graph
settings” (page 6-1-2)
“Configuring Graph
Parameter Settings” (page
9-6-2)