


20050401
10-1-8
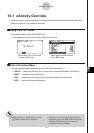
eActivity Overview
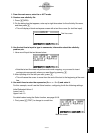
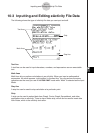
6. Graph the expression using the Graph strip.
1. While the “Graph draw” Graph strip you created in step 5 is selected, press w.
• This will display a graph screen.
2. Press !6(G↔T) to display the Graph Editor screen.
3. In line Y1, input the function (y = 2x
2
+ x – 3) you want to graph.
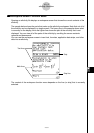
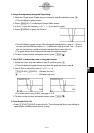
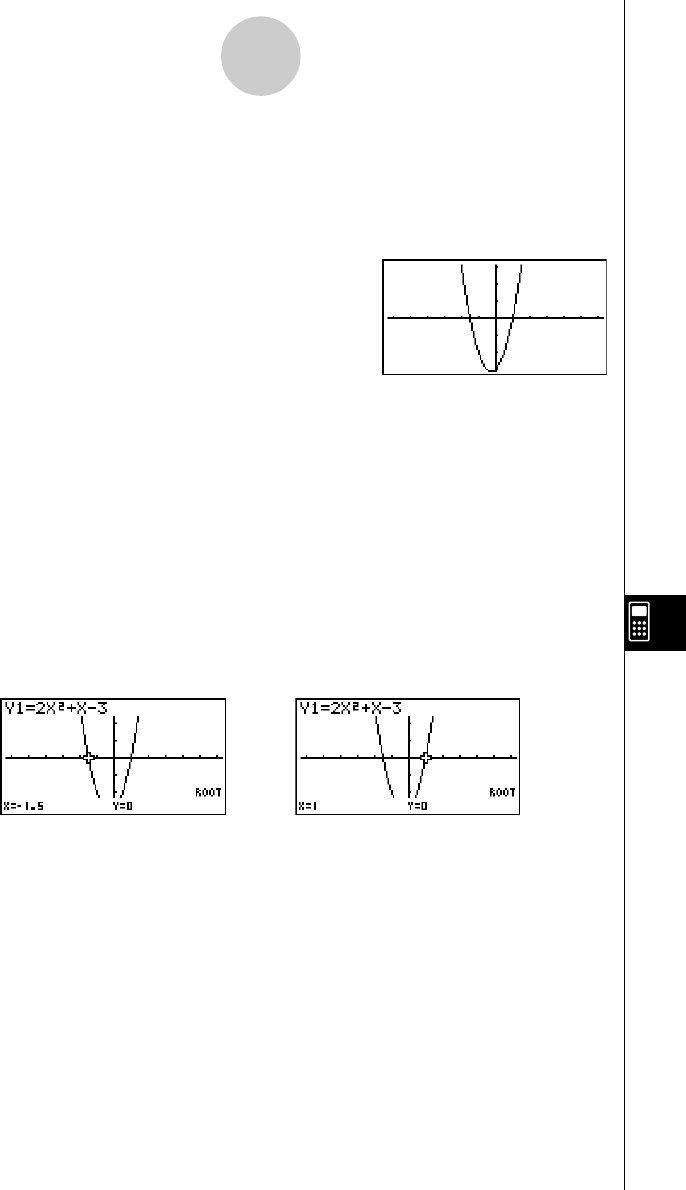
4. Press 6(DRAW) to graph the function.
• This will display a graph screen. Since the graph intersects the x-axis at –1.5 and 1,
we can conclude that the solution (x = 1) obtained in step 4 is valid. The –1.5 value
was not included as a solution because we specified a lower limit of 0.
• The graph drawn here is stored in the strip we created in step 5.
5. To return to the eActivity workspace screen, press !a(
'
).
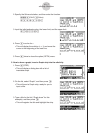
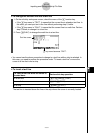
7. Use G-SLV to extract the roots on the graph screen.
1. Select the Graph strip we created in step 5, and then press w.
• This will display the graph screen and draw the graph we drew in step 6.
2. Use G-SLV to extract the roots of y = 2x
2
+ x – 3.
!5(G-SLV) 1(ROOT) .. (Extracts first root.)
e ......................................... (Extracts next root.)
• For details about using G-SLV, see page 5-11-9.
3. To return to the eActivity workspace screen, press !a(
'
).
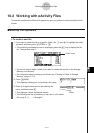
8. Save the eActivity file.
•Press 1(FILE)1(SAVE) to save the file. This will save the file you are editing by
replacing the currently stored version (if any).