


20050401
9-6-5
Statistical Graphs
kk
kk
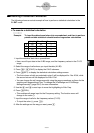
k Configuring Range Settings for Graph Data Cells
The XCellRange and YCellRange settings on the graph settings screen are configured
automatically in accordance with the cells you select on the spreadsheet. You can use the
procedure below to change these settings manually, if you want.
Note that the automatic XCellRange and YCellRange settings always specify a series of
lines in a specific column. With manual settings, you can specify a series of lines in a specific
column, or a series of columns in a specific line.
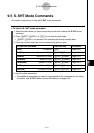
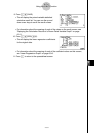
u To change the XCellRange and YCellRange settings manually
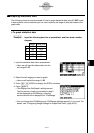
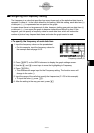
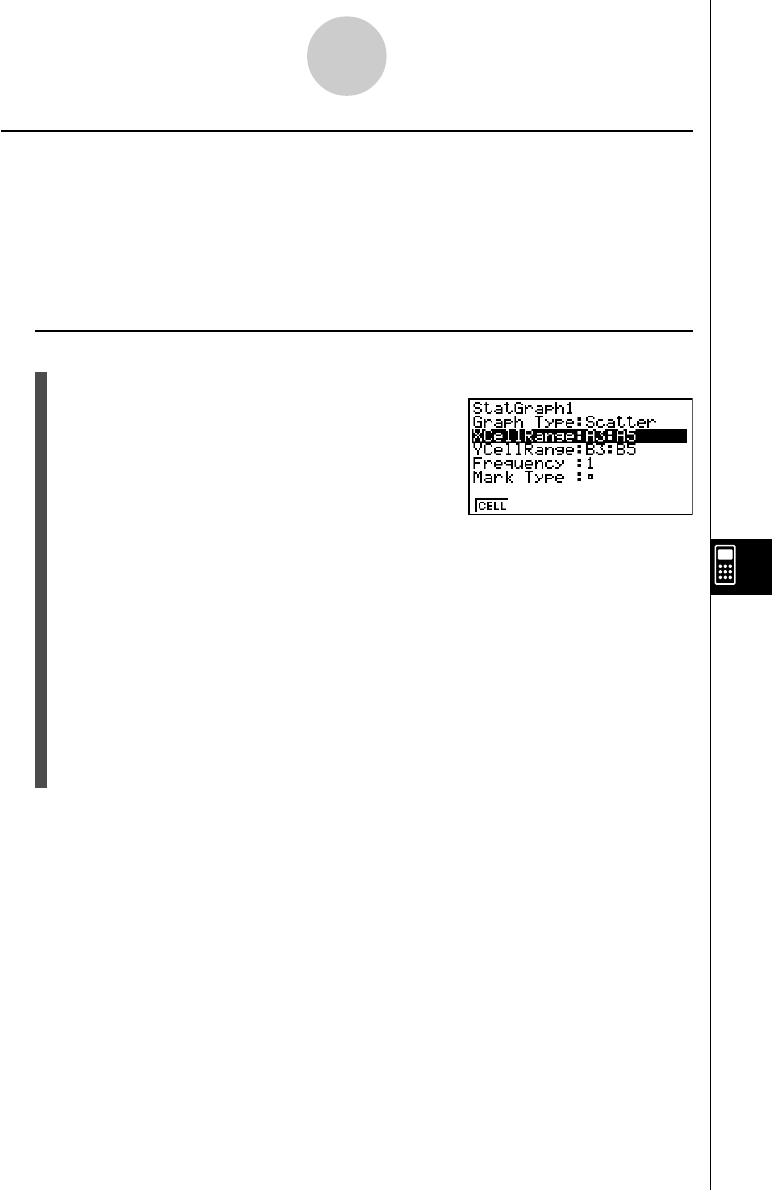
1. Press 6 (SET) on the GRPH submenu to display the graph settings screen.
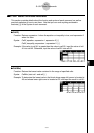
2. Use the f and c cursor keys to move the
highlighting to XCellRange.
3. Press 1 (CELL) or simply input something.
•Pressing 1(CELL) will display the current XCellRange setting (A3:A5 in this
example) with an input cursor, so you can edit it.
• If you simply input something, the current cell range setting will be replaced by what
you input.
•The function menu will change to the colon (:).
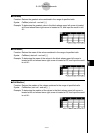
4. Input or edit the cell range.
•To input the colon, press 1(:).
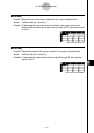
5. After the XCellRange setting is the way you want, press Jc to move to the
YCellRange setting, and then perform steps 3 through 4 to configure its setting.
6. After all the settings are the way you want, press J.