20050401
3. Press w to call up the graph screen.
•Since you have not input any data yet, the graph screen that appears will be blank.
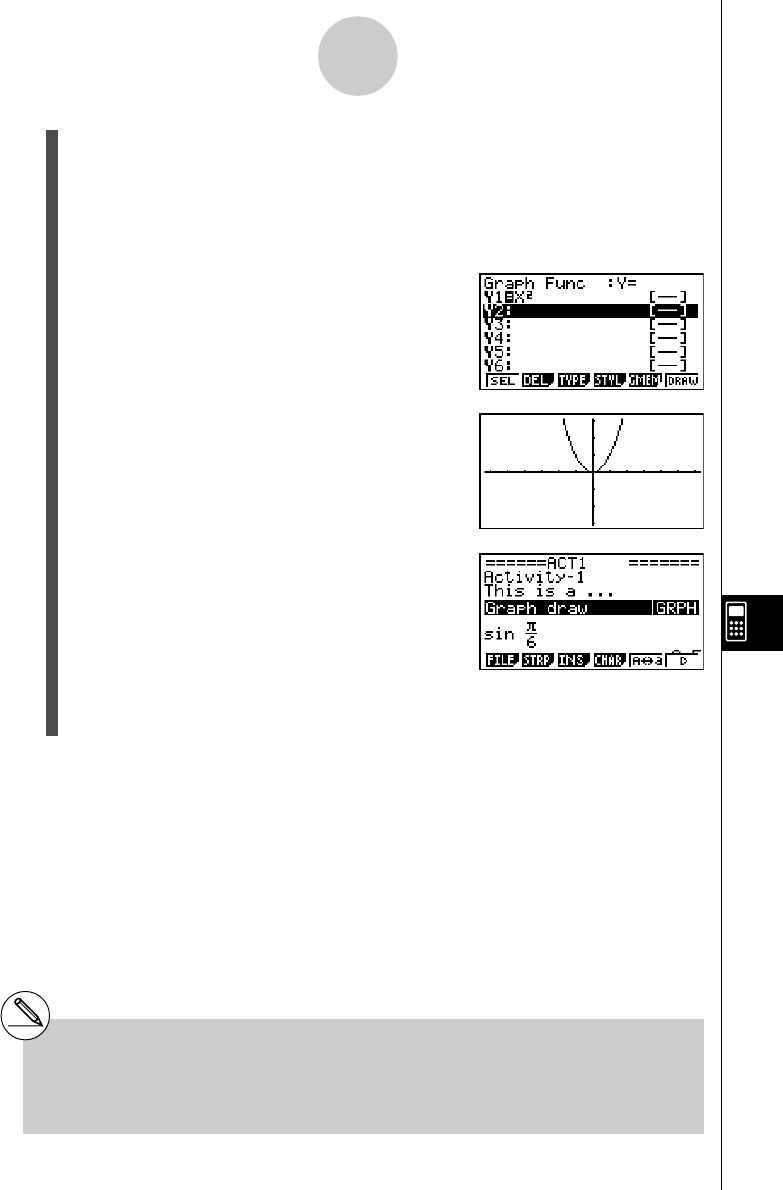
4. Press !6(G↔T) to display the Graph Editor screen.
•This will display the current Graph strip’s Graph relation list. Since this list is
independent of the GRAPH mode Graph relation list, it will be blank because this is a
new Graph strip.
5. Input the function you want to graph (Y1 = X
2
in
this example).
6. Press 6 (DRAW) to graph the function.
•This will display the graph screen with a
graph of the function you input on the Graph
Editor screen.
7. To return to the eActivity workspace screen, press
!a(').
8. Press w again to call up the graph screen.
•This will re-graph the function you input in step 5.
10-3-14
Inputting and Editing eActivity File Data
#You can also paste a previously copied
function from the clipboard into a graph screen
called up from a Graph strip. Note, however,
that a graph produced by pasting the function
is not stored in the memory of the Graph strip. For
more information, see “Using Copy and Paste to
Draw a Graph” (page 10-3-16).
