


3-79
Cisco Signaling Gateway Manager User Guide
78-15589-01
Chapter 3 Managing ITP Networks Using SGM
Working with Linksets
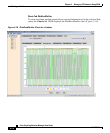
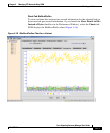
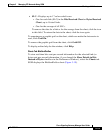
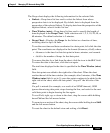
• SLC—Displays up to 17 color-coded icons:
–
One for each link (SLC) in the Bits Received Chart or Bytes Received
Chart, up to 16 total links.
–
One for the average of all SLCs.
To remove the data for a link or for the average from the chart, click the icon
in this field. To return the data to the chart, click the icon again.
To superimpose a graphic grid on the chart, which can make the data easier to
read, click Grid On.
To remove the graphic grid from the chart, click Grid Off.
To display online help for the window, click Help.
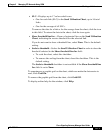
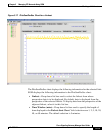
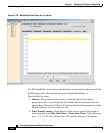
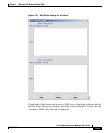
Charts Tab: BitsSentPerSec
To view real-time bits-sent-per-second information for the selected link (or
bytes-sent-per-second information, if you cleared the Show Details in Bits
Instead of Bytes checkbox in the Preferences Window), select the Charts tab.
SGM displays the BitsSentPerSec chart (Figure 3-19).