


3-83
Cisco Signaling Gateway Manager User Guide
78-15589-01
Chapter 3 Managing ITP Networks Using SGM
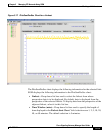
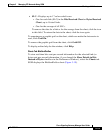
Working with Linksets
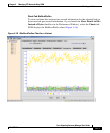
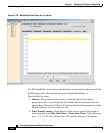
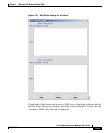
The Drops chart displays the following information for the selected link:
• Linkset—Drop-down list box used to select the linkset from whose
perspective data is to be displayed. By default, data is displayed from the
perspective of the selected linkset. To display data from the perspective of the
adjacent linkset, select it in this list box.
• Time Window (mins)—Drop-down list box used to specify the length of
time displayed in the Drops Chart. Valid selections are 1, 2, 5, 10, 20, 40, or
60 minutes. The default selection is 5 minutes.
• Drops Chart—Displays the Drops for the linkset as a function of time,
including data for up to 16 links.
To see the exact time and data coordinates for a data point, left-click the data
point. The coordinates are displayed in the format (hh:mm:ss, dd.dd), where:
–
hh:mm:ss is the time for that data point in hours, minutes, and seconds.
–
dd.dd is the number of drops for that data point.
To remove the data for a link from the chart, click the icon in the SLC field.
To return the data to the chart, click the icon again.
The total time displayed in the chart is specified in the Time Window (mins)
field.
New data points are added to the right side of the chart. When the chart
reaches the end of the time window (for example, after 5 minutes, if the Time
Window (mins) field is set to 5), new data points continue to be added to the
right side of the chart, while old data points “drop off” the left side of the
chart.
If a poll is missed (for example, as a result of an SNMP timeout), SGM
ignores the missing data point, stops drawing the line, and waits for the next
valid data point to begin drawing the line again.
To scroll left, right, up, or down in the chart, drag the cursor while holding
down Ctrl and the left mouse button.
To zoom in on a section of the chart, drag the cursor while holding down Shift
and the left mouse button.
To reset the chart to the default view and scaling, click Reset.