


55
ICC
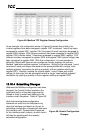
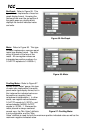
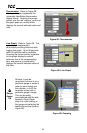
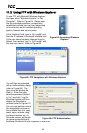
Thermometer: Refer to Figure 58.
This type of meter implements the
universally-identifiable thermometer
display format. Hovering the mouse
pointer over the red “mercury” portion of
the graph pops up a tooltip which
displays the current indicated value and
units.
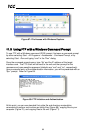
Line Graph: Refer to Figure 59. This
type of graph implements a
continuously-scrolling historical data
logging line graph. Up to 80 seconds
worth of historical data is available.
Hovering the mouse pointer anywhere
on the graph displays a vertical
reference line at the corresponding
time, and pops up a tooltip which
displays the current indicated value at
that time.
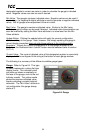
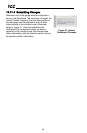
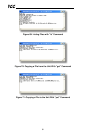
Gauge
Usage
Tip
At times, it may be
convenient to zoom in on a
particular gauge or meter in
order to more clearly see
the indicator, or to fill the
computer screen with a
particular gauge’s image.
This can be easily
accomplished with the web
browser’s Flash Player
plug-in by right-clicking on
the gauge and selecting the
desired zoom level (refer to
Figure 60).
Figure 58: Thermometer
Figure 59: Line Graph
Figure 60: Zooming