


Chapter 6 Monitor
ZyWALL 110/310/1100 Series User’s Guide
80
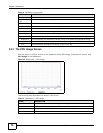
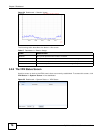
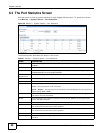
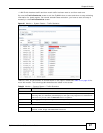
6.2 The Port Statistics Screen
Use this screen to look at packet statistics for each Gigabit Ethernet port. To access this screen,
click Monitor > System Status > Port Statistics.
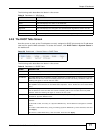
Figure 58 Monitor > System Status > Port Statistics
The following table describes the labels in this screen.
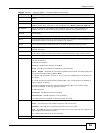
Table 21 Monitor > System Status > Port Statistics
LABEL DESCRIPTION
Poll Interval Enter how often you want this window to be updated automatically, and click Set
Interval.
Set Interval Click this to set the Poll Interval the screen uses.
Stop Click this to stop the window from updating automatically. You can start it again by setting
the Poll Interval and clicking Set Interval.
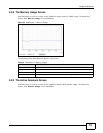
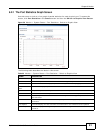
Switch to
Graphic View
Click this to display the port statistics as a line graph.
# This field displays the port’s number in the list.
Port This field displays the physical port number.
Status This field displays the current status of the physical port.
Down - The physical port is not connected.
Speed / Duplex - The physical port is connected. This field displays the port speed and
duplex setting (Full or Half).
TxPkts This field displays the number of packets transmitted from the ZyWALL on the physical
port since it was last connected.
RxPkts This field displays the number of packets received by the ZyWALL on the physical port
since it was last connected.
Collisions This field displays the number of collisions on the physical port since it was last connected.
Tx B/s This field displays the transmission speed, in bytes per second, on the physical port in the
one-second interval before the screen updated.
Rx B/s This field displays the reception speed, in bytes per second, on the physical port in the
one-second interval before the screen updated.
Up Time This field displays how long the physical port has been connected.
System Up Time This field displays how long the ZyWALL has been running since it last restarted or was
turned on.