


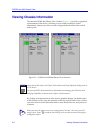
Viewing Chassis Information 2-9
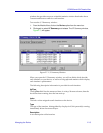
CSX200 and 400 Chassis View
connected to the port compared to the theoretical maximum load (10 or 100
Mbits/sec) of an Ethernet network.
Errors
If you choose the Errors mode, the interface boxes will display the percentage of
the total number of valid packets processed by each port during the last polling
interval that were error packets. This percentage reßects the number of errors
generated during the last polling interval by devices connected to that port
compared to the total number of valid packets processed by the port.
I/F Mapping
If you choose the I/F Mapping mode, the interface boxes will display the interface
number (IfIndex) associated with each port on the CSX200/400.
I/F Speed
If you choose the I/F Speed mode, the port text boxes will display the speed of the
network segment connected to each port. The speed of the network management
port will be displayed in Kbits/sec.
I/F Type
If you choose the I/F Type mode, the interface boxes will display the interface
type of each port on the CSX200/400 (e.g., Eth, PPP, other).
Port Status Color Codes
The Port Status display options Ñ Bridge, Admin, and Operator Ñ incorporate
color coding schemes. For the Admin and Operator Status display options,
green = ON, red = OFF, and blue = N/A (not available). For the Bridge Status
display option, green = forwarding, blue = disabled, magenta = learning and
listening, orange = blocking, red = broken, and gray = unknown.
For all other Port Status selections Ñ Load, Errors, I/F Port Mapping, Speed, and
Type Ñ color codes will continue to reßect the most recently selected mode which
incorporates its own color coding scheme.
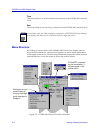
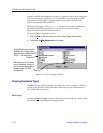
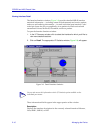
The Chassis Manager Window
Like most networking devices, the CSX200/400 draws its functionality from a
collection of proprietary MIBs and IETF RFCs. In addition, the CSX200/400
organizes its MIB data into a series of Òcomponents.Ó A MIB component is a
logical grouping of MIB data, and each group controls a deÞned set of objects. For
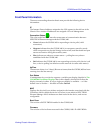
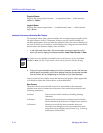
NOTE
In SPECTRUM Element Manager, the polling interval is set via the Tools Ñ>
Options...Ñ>Polling option from the main windowÕs menu bar. Refer to the Installing
and Using SPECTRUM Element Manager guide for full information on setting device
polling intervals.