Bridge Statistics 4-21
Bridging
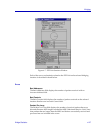
The Interface Statistics Window
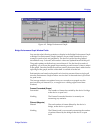
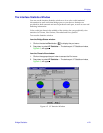
You can use the interface Statistics window to view color-coded statistical
information for each individual bridge port on your device. Statistics are
provided for both transmit and receive packets at each port, as well as error and
buffering information.
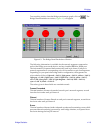
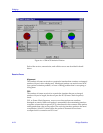
Color-coded pie charts in the middle of the window lets you graphically view
statistics for Unicast, Non-Unicast, Discarded and Error packets.
To access the Statistics window
from the Bridge Status window:
1. Click on the desired Port button ( ) to display the port menu.
2. Drag down to select I/F Statistics…. The device port I/F Statistics window,
Figure 4-5, will appear.
from the Chassis View window:
1. Click on the appropriate port index to access the Port menu.
2. Drag down to select I/F Statistics…. The device port I/F Statistics window,
Figure 4-5, will appear.
Figure 4-5. I/F Statistics Window


