


Bridging
4-18 Bridge Statistics
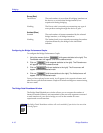
Errors (Red)
Total Errors The total number of errors that all bridging interfaces on
the device, or an individual bridge interface, has
experienced during bridging.
Nothing The Errors scale is currently not measuring any type of
error packets coming through the device or port.
Xmitted (Blue)
Xmitted The total number of frames transmitted by the selected
bridge interface, or all bridge interfaces.
Nothing The Xmitted scale is not currently measuring the number
of packets Þltered by the bridge or the individual
interface.
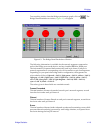
Configuring the Bridge Performance Graphs
To conÞgure the Bridge Performance Graph:
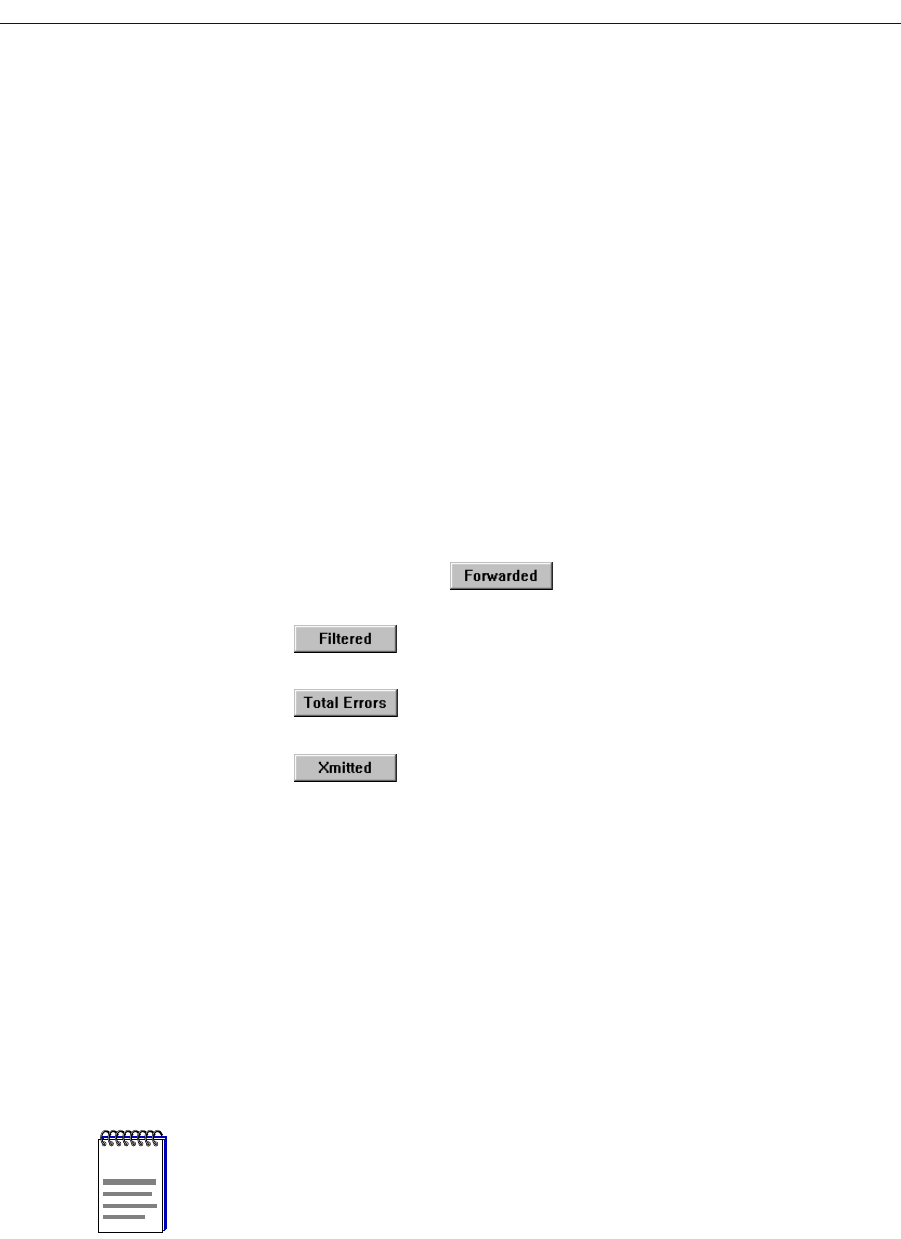
1. Using the mouse, click on (with green statistics to the right). The
Forwarded menu will appear. Click on the desired mode.
2. Click on (with magenta statistics to the right). The Filtered menu
will appear. Click on the desired mode.
3. Click on (with red statistics to the right). The Errors menu will
appear. Click on the desired mode.
4. Click on (with blue statistics to the right). The Xmitted menu will
appear. Click on the desired mode.
Once you have selected a new mode, it will appear in its respective button, and
after the next poll the Performance Graph will refresh and begin to measure using
the new mode.
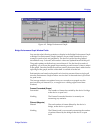
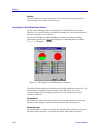
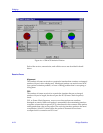
The Bridge Detail Breakdown Window
The Bridge Detail Breakdown window allows you to compare the number of
frames forwarded, Þltered, and transmitted on the network segments connected
to each interface of your device bridge, as well as the number of errors
experienced on each interface.
NOTE
The Bridge Detail Breakdown window will not be available if your device has more than
13 bridge ports.