P-2302HWUDL-P1 Series User’s Guide
261
CHAPTER 23
Logs
Use these screens to look at log entries and alerts and to configure the ZyXEL Device’s log
and alert settings.
23.1 Logs Overview
For a list of log messages, see Section 23.3 on page 265.
23.1.1 Alerts
An alert is a type of log that warrants more serious attention. Some categories such as System
Errors consist of both logs and alerts.
23.1.2 Syslog Logs
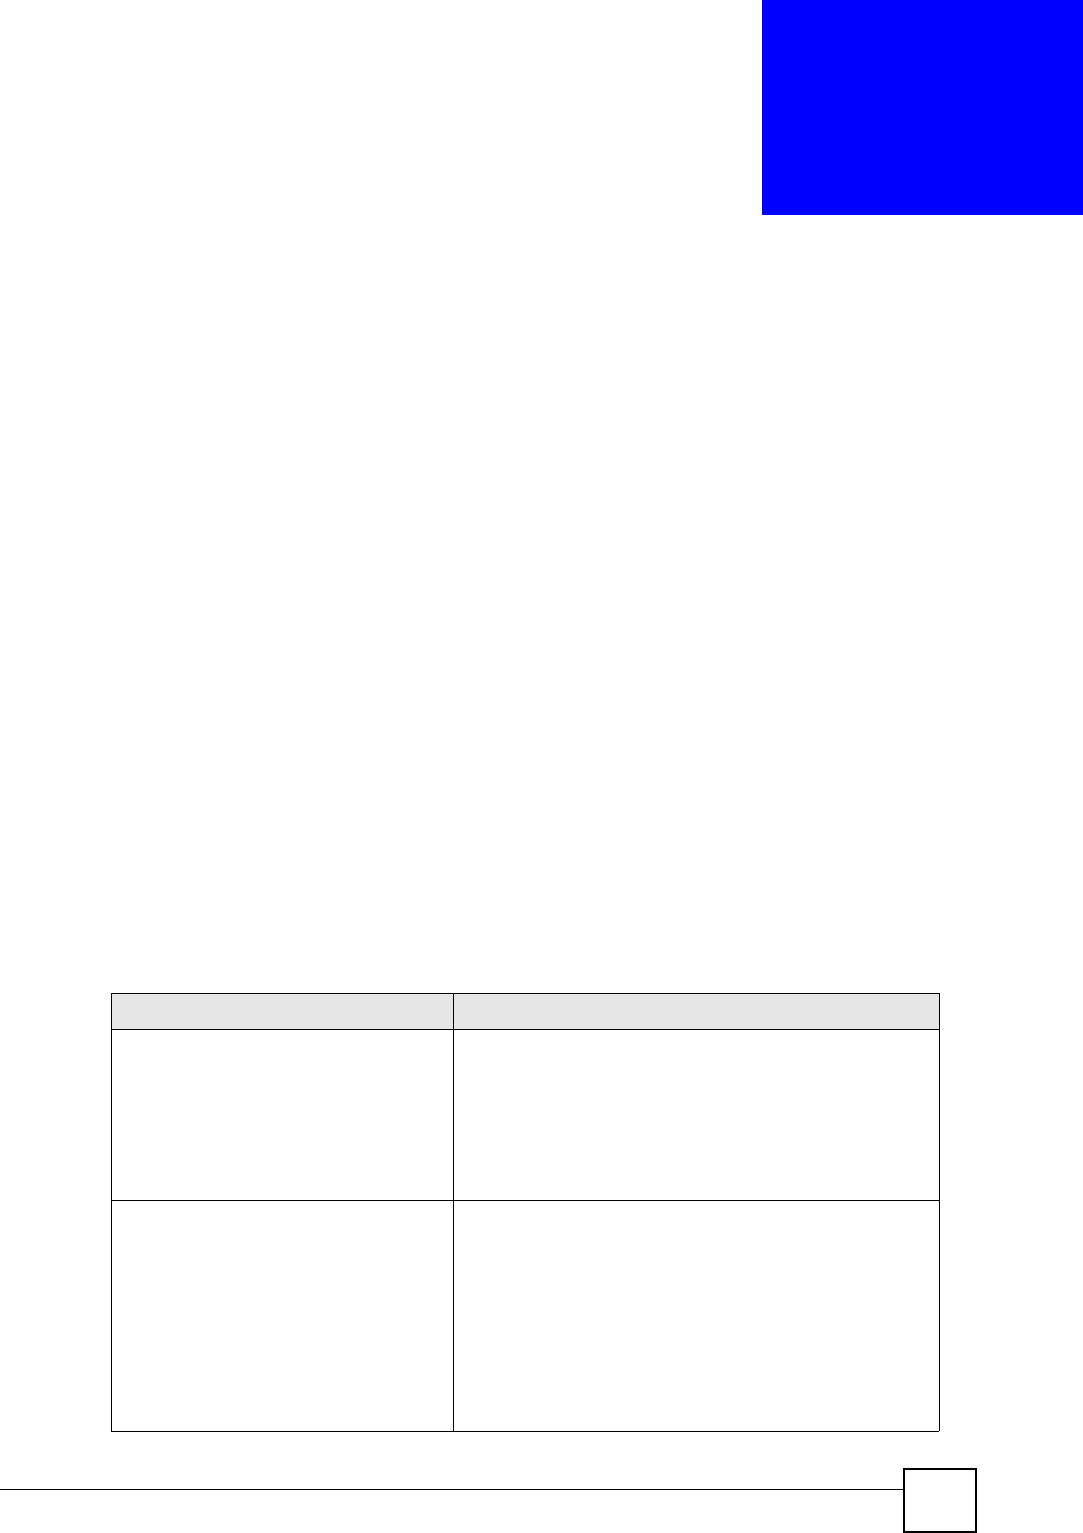
There are two types of syslog: event logs and traffic logs. The device generates an event log
when a system event occurs, for example, when a user logs in or the device is under attack.
The device generates a traffic log when a "session" is terminated. A traffic log summarizes the
session's type, when it started and stopped the amount of traffic that was sent and received and
so on. An external log analyzer can reconstruct and analyze the traffic flowing through the
device after collecting the traffic logs.
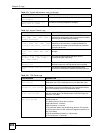
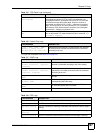
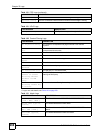
Table 109 Syslog Logs
LOG MESSAGE DESCRIPTION
Event Log: <Facility*8 + Severity>Mon
dd hr:mm:ss hostname
src="<srcIP:srcPort>"
dst="<dstIP:dstPort>" msg="<msg>"
note="<note>" devID="<mac address>"
cat="<category>"
This message is sent by the system ("RAS" displays as the
system name if you haven’t configured one) when the
router generates a syslog. The facility is defined in the Log
Settings screen. The severity is the log’s syslog class. The
definition of messages and notes are defined in the various
log charts throughout this chapter. The “devID” is the MAC
address of the router’s LAN port. The “cat” is the same as
the category in the router’s logs.
Traffic Log: <Facility*8 + Severity>Mon
dd hr:mm:ss hostname
src="<srcIP:srcPort>"
dst="<dstIP:dstPort>" msg="Traffic Log"
note="Traffic Log" devID="<mac
address>" cat="Traffic Log"
duration=seconds sent=sentBytes
rcvd=receiveBytes dir="<from:to>"
protoID=IPProtocolID
proto="serviceName"
This message is sent by the device when the connection
(session) is closed. The facility is defined in the Log
Settings screen. The severity is the traffic log type. The
message and note always display "Traffic Log". The "proto"
field lists the service name. The "dir" field lists the incoming
and outgoing interfaces ("LAN:LAN", "LAN:WAN",
"LAN:DEV" for example).


