


5-51
User Guide for the CiscoWorks 1105 Wireless LAN Solution Engine
78-14947-01
Chapter 5 Using Reports
Displaying Trends
–
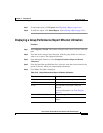
Group Performance Report: Ethernet Utilization—See Displaying a
Group Performance Report: Ethernet Utilization, page 5-53.
–
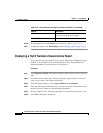
Top N Number of Associations—See Displaying a Top N Number of
Associations Report, page 5-54
–
Top N Percentage Errors—See Displaying a Top N Percentage Errors,
page 5-55
• Individual Access Point and Bridge Reports
–
AP and Bridge RF Transmission Statistics—See Displaying an AP and
Bridge RF Transmission Statistics Report, page 5-56.
–
AP and Bridge Ethernet Transmission Statistics—See Displaying an AP
and Bridge Ethernet Transmission Statistics Report, page 5-58.
–
AP and Bridge Performance: Graph—See Displaying an AP and Bridge
Performance Graph, page 5-60.
–
AP and Bridge Performance: Tabular—See Displaying an AP and Bridge
Performance: Tabular, page 5-61.
–
Top N Busiest Clients—See Displaying Top N Busiest Clients, page 5-62
–
Top N Client Error Rate—See Displaying Top N Client Error Rate,
page 5-64
• Servers
Server Response Time Graph—See Displaying a Server Response Time
Graph, page 5-65.
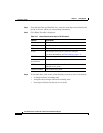
Displaying a Group Performance Report: RF Utilization
Procedure
Step 1 Select Reports > Trends. The window refreshes with a device selector in the left
pane.
Step 2 From the device selector in the left pane, click the group folder for which you
want a report. The right pane refreshes.
Step 3 From the Report Name list, select Group Performance Report: RF Utilization.