


Chapter 5 Using Reports
Displaying Trends
5-58
User Guide for the CiscoWorks 1105 Wireless LAN Solution Engine
78-14947-01
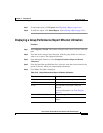
Displaying an AP and Bridge Ethernet Transmission Statistics
Report
This report displays the transmit and receive rates overlaid in a graph.
Procedure
Step 1 Select Reports > Trends. The window refreshes with a device selector in the left
pane.
Step 2 If you want to search for the device, use the dialog box in the left pane above the
device selector:
a. From the list, select the method you want to use to search for the device: by
name or by IP address.
b. Enter the IP address or name, or use an asterisk (*) as a wildcard to denote
numbers and letters, then click Search. The requested device appears in the
Search Results folder.
Step 3 From the device selector in the left pane, click to expand the folder, then select
the devices for which you want to see a report. The right pane refreshes.
Step 4 From the Report Name list, select AP and Bridge Ethernet Transmission
Statistics.
Step 5 From the Start Date and End Date lists, select the start date and end date for the
period of time for which you want trending information.
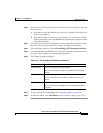
Step 6 Click View. A graph is displayed:
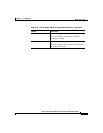
Table 5-36 AP and Bridge Ethernet Transmission Statistics
Column Description
Transmit Rate The x-axis displays the time intervals.
The y-axis displays the number of packets
transmitted per second.