


5-59
User Guide for the CiscoWorks 1105 Wireless LAN Solution Engine
78-14947-01
Chapter 5 Using Reports
Displaying Trends
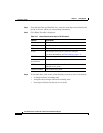
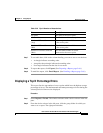
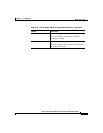
Receive Rate The x-axis displays the time intervals.
The y-axis displays the number of packets
received per second.
Packet Errors The x-axis displays the time intervals.
The y-axis displays the number of error packets
per number of packets.
Table 5-36 AP and Bridge Ethernet Transmission Statistics (continued)
Column Description