


19
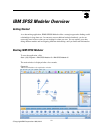
IBM SPSS Modeler Overview
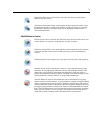
Field Ops.
Nodes perform operations on data fields, such as filtering, d eriving new field s, and
determining the measurement level for given fields.
Graphs.
Nodes grap hically display data before and after modeling. Graphs include plots,
histograms, web nodes, and evalua tion charts.
Modeling.
No
des us e the modeling algorithms available in SPSS Modeler, such a s neural n ets,
decision trees, clustering algorithms, and data sequencing.
Database Modeling.
Nodes use the modeling algorithms available in Microsoft SQL Server,
IBM DB2, and Oracle databases.
Output.
Nodes produce a variety of output for data, charts , and mod el results that can be
viewed in SPSS Modeler.
Export.
Nod
es produce a variety of output that can be viewed in external applications, such
as IBM® SPSS® Data Collection or Excel.
SPSS Statistics.
Nodes import data from, or export data to, IBM® SPSS® Statistics , as well as
running SPSS Statistics procedures.
As you become more familiar with SPSS Modeler, you can customize the palette contents for
your own use. For more information, see the topic Customizing the N odes Palette in Chapter 12
on p. 223.
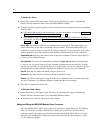
Located below the Nodes Palette, a report pane provides feedback on the progress of various
operations, such as when data is being read into the data str eam. Also located below the Nodes
Palette, a status pane provides information on what the application is currently doing , as well as
indicatio ns of when user feedback is required.
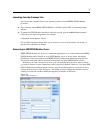
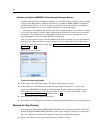
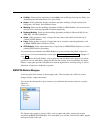
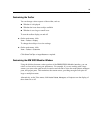
IBM SPSS Modeler Managers
At the top right of the window is the managers pane. This has three tabs, which are used to
manage streams, output and models.
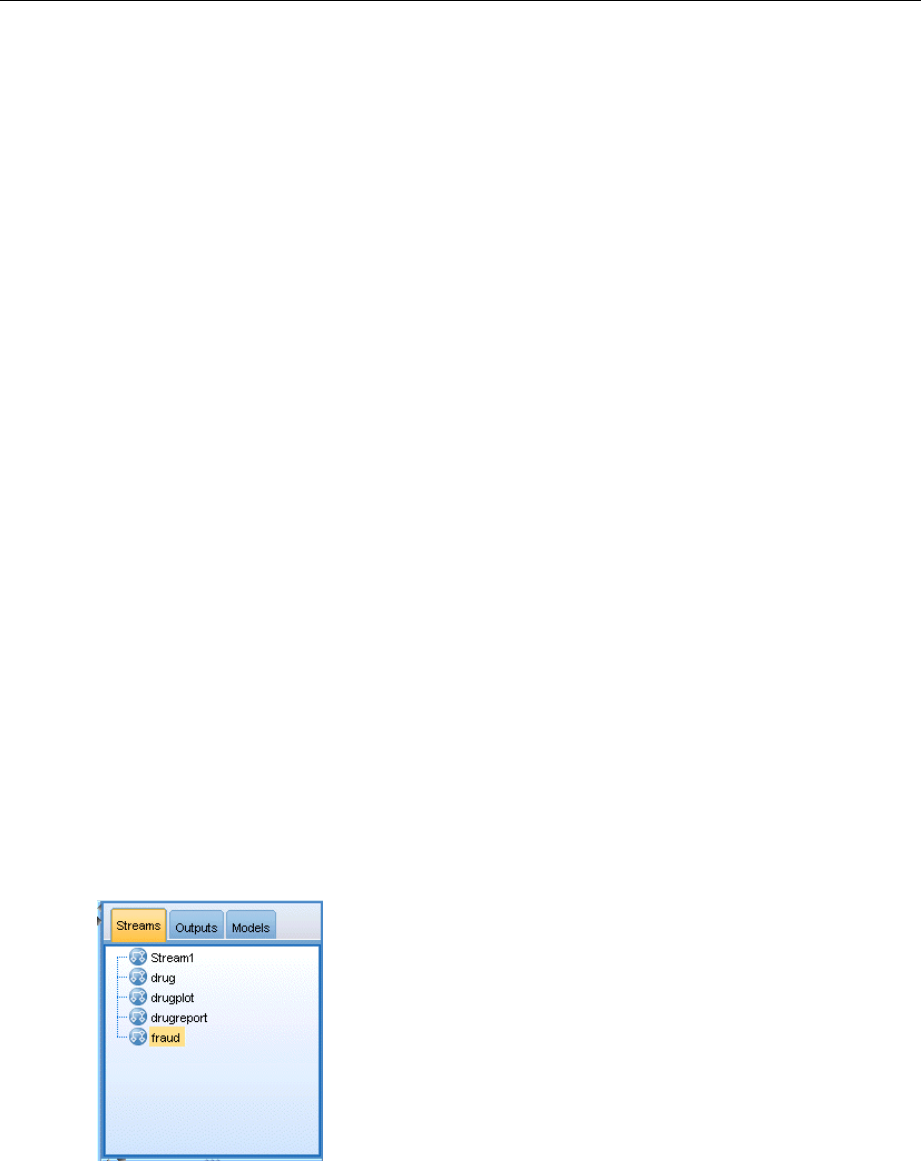
You can use the Streams tab to open, rename, s ave, a nd delete the streams created in a session.
Figure 3-7
Streams tab
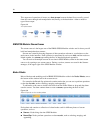
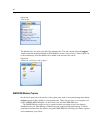
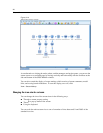
The Outpu ts tab contains a var iety of files, such as graphs and tables, produced by str eam
operations in IBM® SPSS® Mod eler. You can display, save, rename, and close the tables, graphs ,
and reports listed on this tab .