


42
Chapter 5
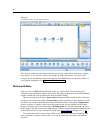
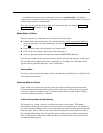
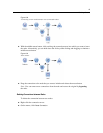
Figure 5-1
Completed stream on the stream canvas
This section contain s more detailed informati on on working with node s to create more complex
data streams. It also discusses options and settings for nodes and streams. For step-by-step
examples of stream building using the data shipped with SPSS Modeler (in the Demos folder of
your program installation), see Application Examples on p. 5.
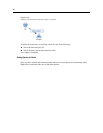
Working with Nodes
Nodes are used in IBM® SPSS® Modeler to help you explore data. Various nod es in the
workspace re present different objects and actions. The palette at the bottom of the SPSS Modeler
window contains all of the possible nodes used in stream buildi ng.
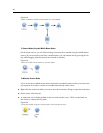
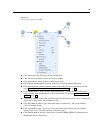
There are several types of nodes. Source nodes bring data into the st r eam, and are located on
the Sources tab of the nodes palette. Process nodes perform operations on individual d ata records
and fields, and can be found in the Record Ops and Field Ops tabs of the palette. Output nodes
produce a variety of output for data, charts and model results, and are included on the Graphs,
Output and Export tabs of the nodes palette. Modeling nodes use statistical algorithms to create
model nuggets, and are located on the Modeling tab, and (if activated) the Database Modeling tab,
of th e nodes palette. For more inform ation, see the topic Nodes Palette in Chapter 3 on p. 18.
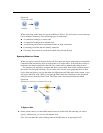
You connect the nodes to form streams which, when run, let you visualize relationships and
draw conclusions. Streams are like scripts—you can save them and reuse them with different
data files.