


82 Pelco Manual C690M-E (11/04)
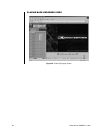
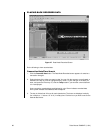
2. Click the Diagnostics button again and the title at the top of the screen changes to
DIAGNOSTIC MODE – FIELD. In this mode, the start and end of the transaction are used
to display the data in the data area—as in the normal mode. However, in this mode, any
special field that is found is displayed in brackets with the following codes:
[TM] Time
[DT] Date
[TN] Transaction number
[EF] End of transaction found
[SF] Start of transaction found
[SFSF] Start of transaction found followed by another start of transaction (no end of
transaction in between)
[P xT x] Exception found. Data port x (1-16) trigger x (1-16)
[GP xT x] Global transaction item satisfied on data port x (1-16) trigger x (1-16)
[L1P xT x] First line item satisfied on data port x (1-16) trigger x (1-16)
[L2P xT x] Second line item satisfied on data port x (1-16) trigger x (1-16)
[MP xT x] Monetary line item satisfied on data port x (1-16) trigger x (1-16)
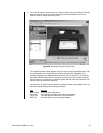
3. Click the Diagnostics button again to return to normal operating mode. The title at the top
of the screen changes back to DATA MODE LIVE.
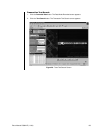
4. While in either diagnostic mode, Status displays a green LED for a good condition and a
red LED when the communication settings are incorrect. The following items are displayed
in the Status field:
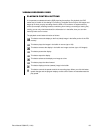
LED Meaning
PE Parity error
FE Framing error
STP Stop bit error
OV Data output overflow
IV Data input overflow