7 Windows/Dialogs
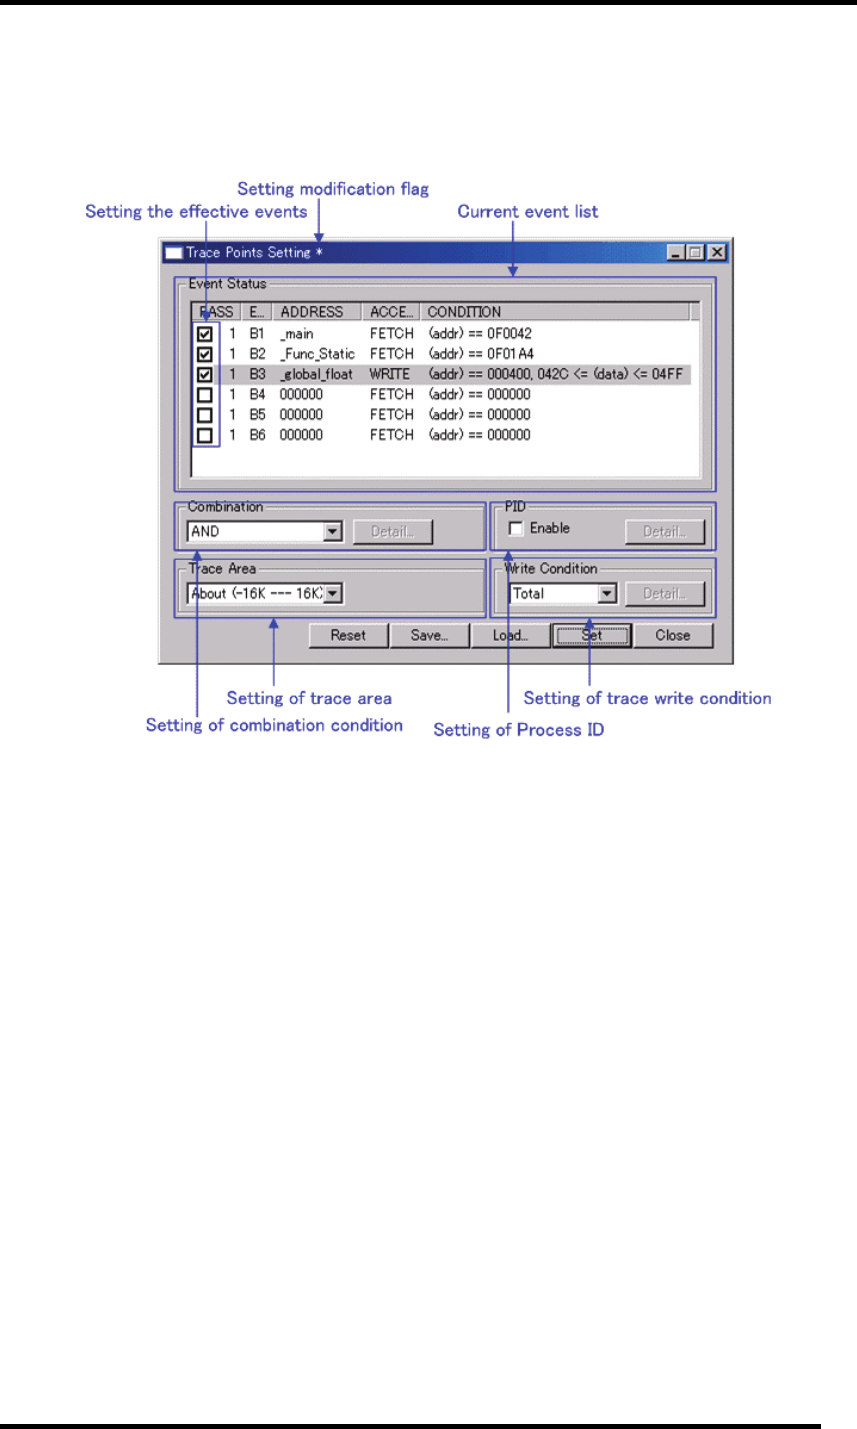
7.9 Trace Point Setting Window
The Trace Point Setting window is used to set trace points.
• The events listed below can be specified as trace events. If the contents of events are altered, they
are marked by an asterisk (*) on the title bar. The asterisks (*) are not displayed after setting up
the emulator.
- The debugger for M32C
Memory Access, Bit Access, Trigger
(* Can be substituted by memory access. (Access type = Read))
- The debugger for M16C/R8C
Fetch, Memory Access, Bit Access, Interrupt, Trigger
- The debugger for 740
Fetch, Memory Access, Bit Access, Interrupt, Trigger
• Events at up to six points can be used.
• These events can be combined in one of the following ways:
- Trace when all of the valid events are established (AND condition)
- Trace when all of the valid events are established at the same time (simultaneous AND
condition)
- Trace when one of the valid events is established (OR condition)
- Trace upon entering a break state during state transition (State Transition condition)
147


