


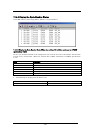
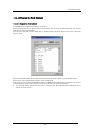
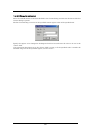
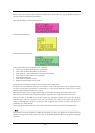
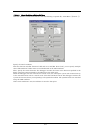
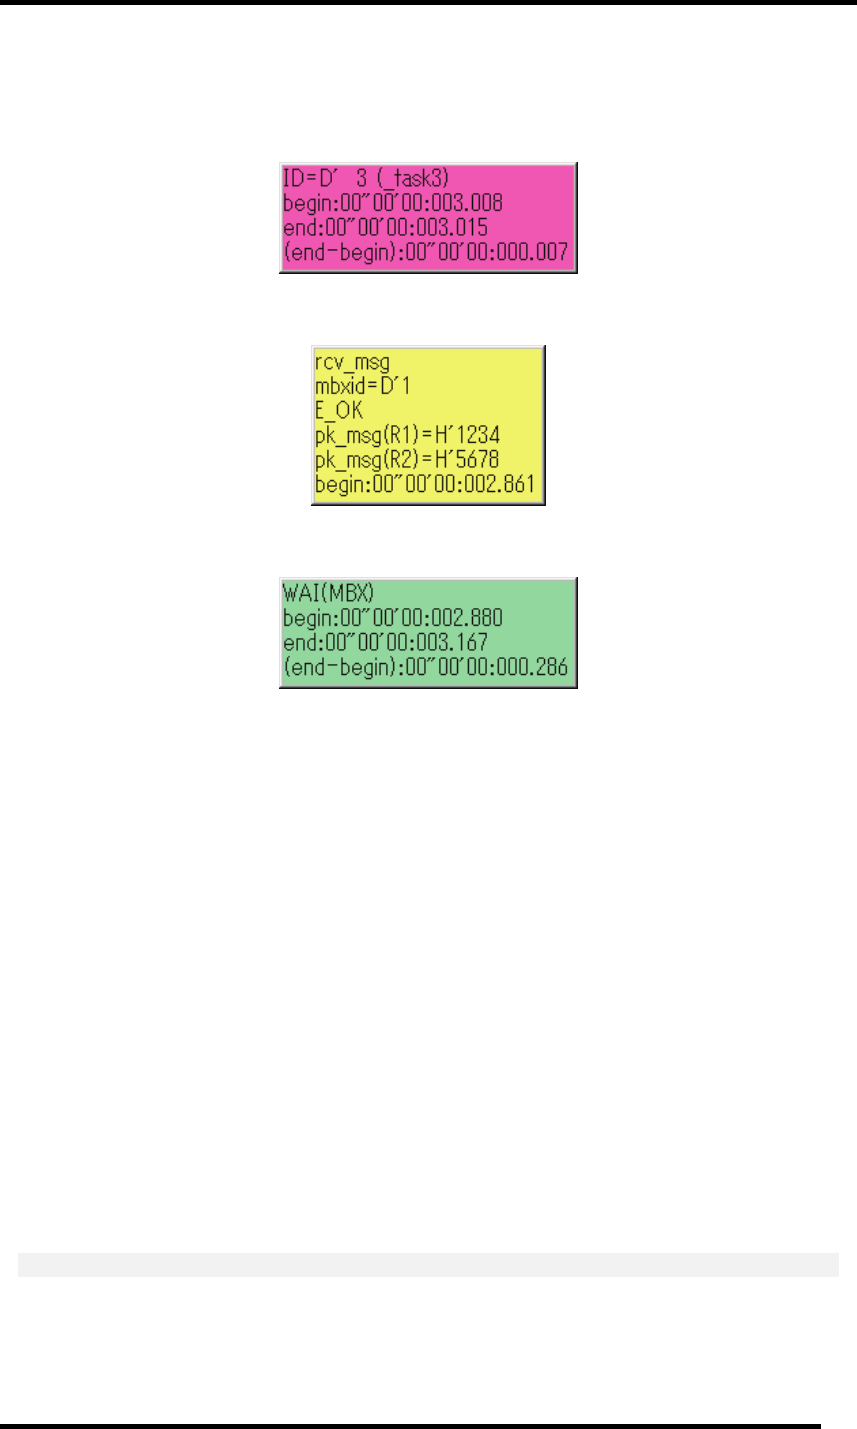
When moving the mouse to the information displayed in the window, the pop up window as below is
opened, showing the detailed information.
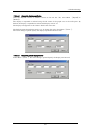
Interrupt handling or task execution history
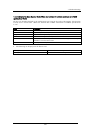
System call issue history
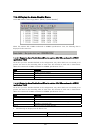
Task state transition history
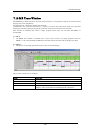
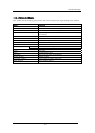
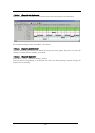
Following information is displayed in the status bar.
• Time value at which start marker is positioned
• Time value at which end marker is positioned
• Time width of a range indicated by start and end markers
• Time value at which indicator is positioned
• Scale factor of display
• Time width of grid line interval
• Range of measurement (trace) result
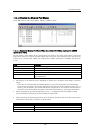
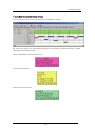
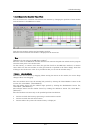
The grid lines are displayed using the start marker as the radix point.
The grid lines are displayed using the start marker as the radix point. The scale is displayed, using
the time at which the start marker is positioned as 0, with the left (forward in time) set to "minus"
and the right (backward in time) set to "plus".
The grid lines allow you to roughly understand the interrupt occurrence cycle and process time.
The interval time width of the displayed grid lines appears in the "Grid" area of the status bar.
The time value in the MR Trace window means the execution elapsed time using the program
execution start time as 0 in all the cases. On the contrary, the numeric value above the grid lines
(scale) in the MR Trace window is a relative value using the start marker as 0 (the grid interval is
specified in the Value dialog).
It has nothing to do with the time value. (This is provided so that you can see the window easily.)
Note
The software interrupt number*1 is different according to product. For details about which interrupt
number is assigned to which system call, refer to the MRxx Reference Manual, "Assemble Language
Interface."
210