6 Tutorial
6.2.13 Step13 : Stack Trace Function
The debugger uses the information on the stack to display the names of functions in the sequence of
calls that led to the function to which the program counter is currently pointing.
The debugger for 740 doesn't support the stack trace function.
6.2.13.1 Reference the function call status
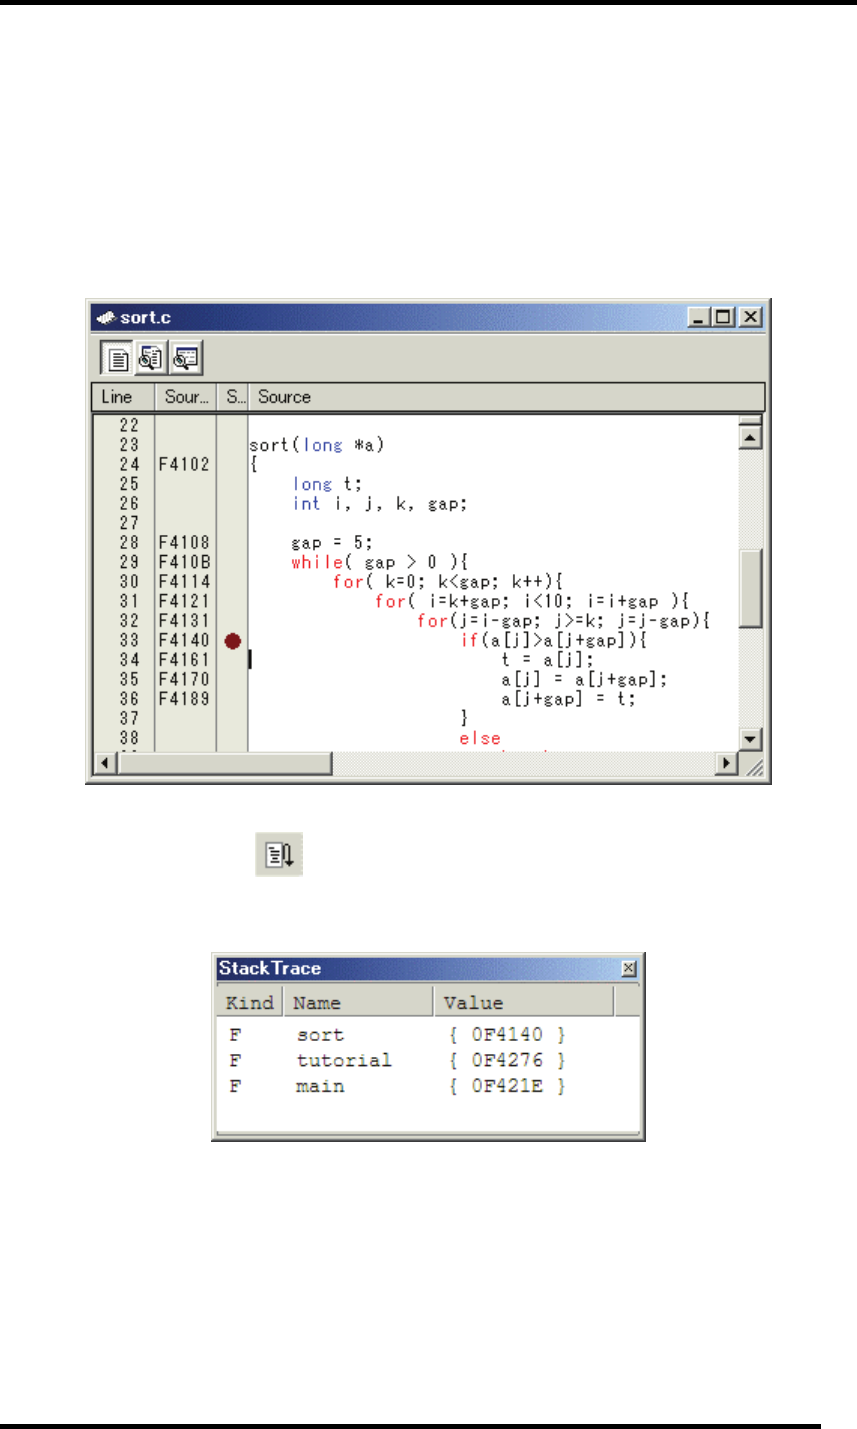
Double-click the [S/W Breakpoints] column in the sort function and set a software breakpoint.
To executes the user program from the reset vector address, select [Reset Go] from the [Debug] menu,
or click the [Reset Go] button
on the toolbar.
After the break in program execution, select [Stack Trace] from the [Code] submenu of the [View]
menu to open the [Stack Trace] window.
The upper figure shows that the position of the program counter is currently at the selected line of the
sort() function, and that the sort() function is called from the tutorial() function.
79


