


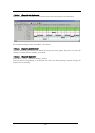
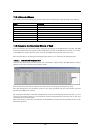
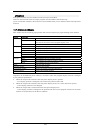
7.16.4 Extended Menus
This window has the following popup menus that can be brought up by right-clicking in the window.
Menu Function
Run Time CPU occupancy status display mode.
Rdy->Run Ready state duration display mode.
System Call System call history display mode.
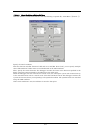
Pick Up System Call... Extract specified system calls display mode.
Toolbar display Display toolbar.
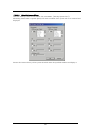
Customize toolbar... Open toolbar customize dialog box.
Allow Docking Allow window docking.
Hide Hide window.
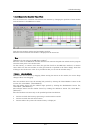
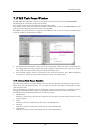
7.16.5 Analyze the Execution History of Task
You can reference the execution history statistical processing in the MR Analyze window. The MR
Analyze window functions together with the MR Trace window. If the MR Trace window is not open,
or the MR Trace window does not show any data, the MR Analyze window will not function.
The execution history statistical processing function allows you to reference the following topics.
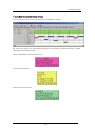
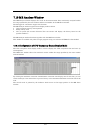
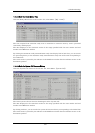
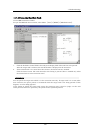
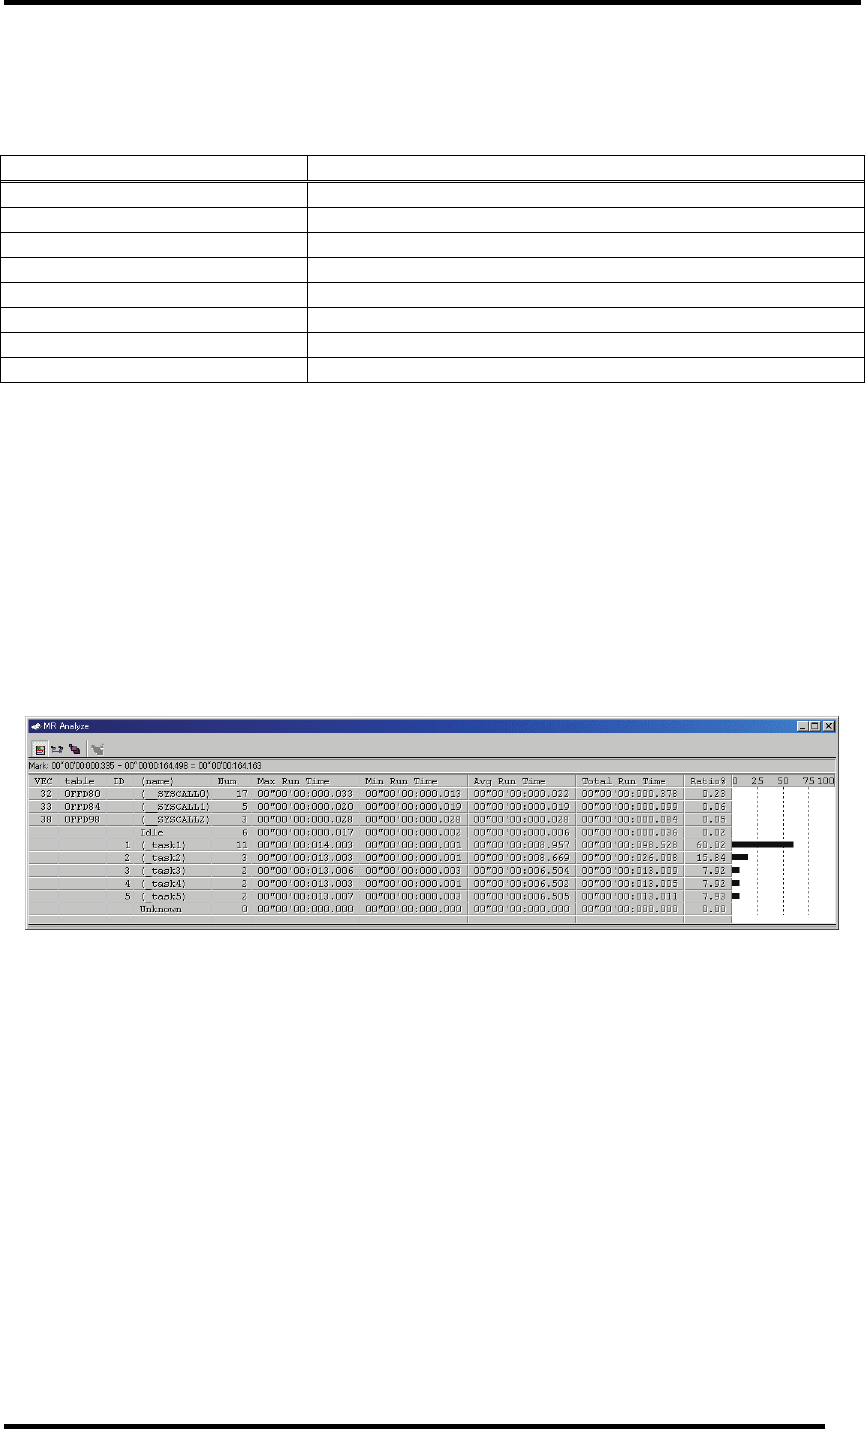
7.16.5.1.1. Refer the CPU Occupation State
Click the Run Time button in the tool bar. (Or, select Menu - [Run Time].) The MR Analyze window
changes to the CPU occupation state display mode.
The window shows the CPU occupation time and ratio by interrupt processing and by task.
The data displayed is the statistical results for the range specified with the start marker and end
marker in the MR Trace window.
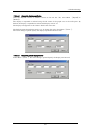
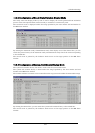
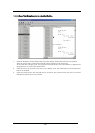
By clicking the maximum execution time/minimum execution time display field of each line, you can
search the processing history at the maximum execution time/minimum execution time of the task
corresponding to the clicked line.
The search result is pointed by the indicator in the MR Trace window after the indicator moves to the
destination position.
220