1.3 Real-Time Trace Function
This function records a target program execution history.
Up to 32K cycles of execution history can be recorded. This record allows inspecting the bus
information, executed instructions, and source program execution path for each cycle.
The real-time trace function records the execution history of the target program.
The execution history is referred to in the tracing window.
The execution history can be referred to in the following mode.
• BUS mode
This mode allows you to inspect cycle-by-cycle bus information. The display content depends on
the MCU and emulator system used. In addition to bus information, this mode allows
disassemble, source line or data access information to be displayed in combination.
• Disassemble mode
This mode allows you to inspect the executed instructions. In addition to disassemble information,
this mode allows source line or data access information to be displayed in combination.
• Data access mode
This mode allows you to inspect the data read/write cycles. In addition to data access information,
this mode allows source line information to be displayed in combination.
• Source mode
This mode allows you to inspect the program execution path in the source program.
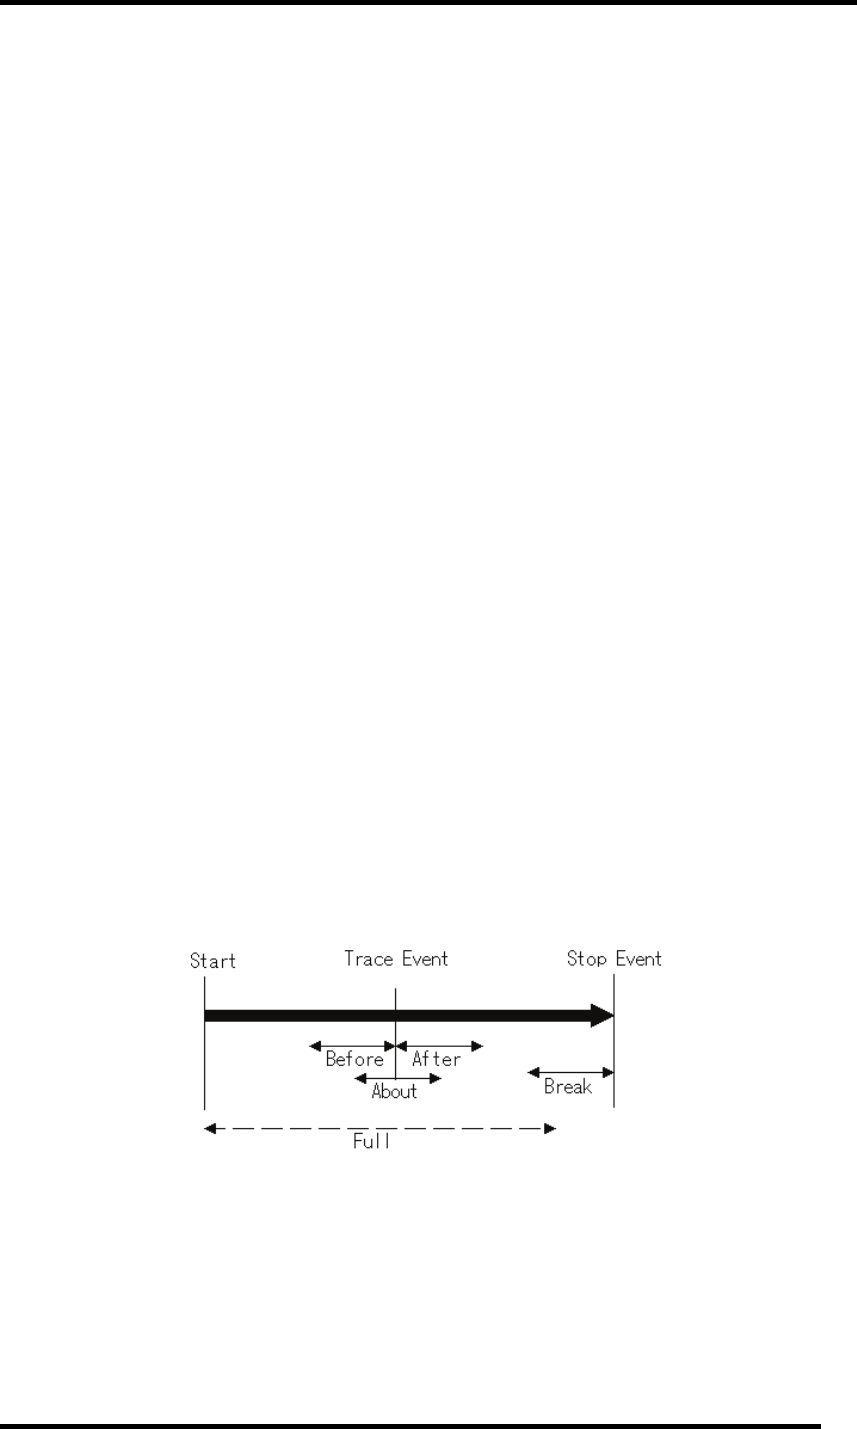
1.3.1 Trace Area
The 32K cycles execution history can be referred to with this debugger.
The trace area of the following 5 mode is being supported.
• Break
32K cycles before target program stops
• Before
32K cycles before trace point
• About
16K cycles either side of trace point
• After
32K cycles after trace point
• Full
Until 32K cycles are written in the trace memory
"Break" is set by default. To refer the execution history before stopping the target program, use
"Break" (designation of trace event is not required).
To refer the execution history at any position, or to continue execution of the target program, specify
the trace event and change the trance range.
6


