


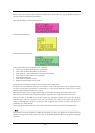
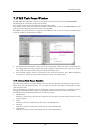
7.16 MR Analyze Window
The MR Analyze window displays the result of the measurement data statistically analyzed within
the range specified by the start marker and the end marker in the MR Trace window.
The debugger for 740 doesn't support this function.
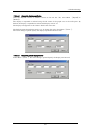
The MR Analyze window supports three display mode as below:
• CPU occupation state by interrupt/task
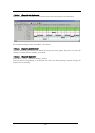
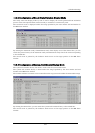
• Ready time by task
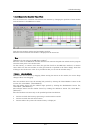
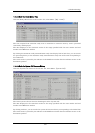
• List of system call issuance histories (You can extract and display the history based on the
specific condition.)
The MR Analyze window functions together with the MR Trace window.
This window is available only when a target program using our real time OS (MRxx) is downloaded.
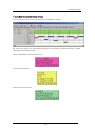
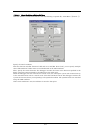
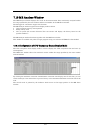
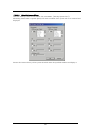
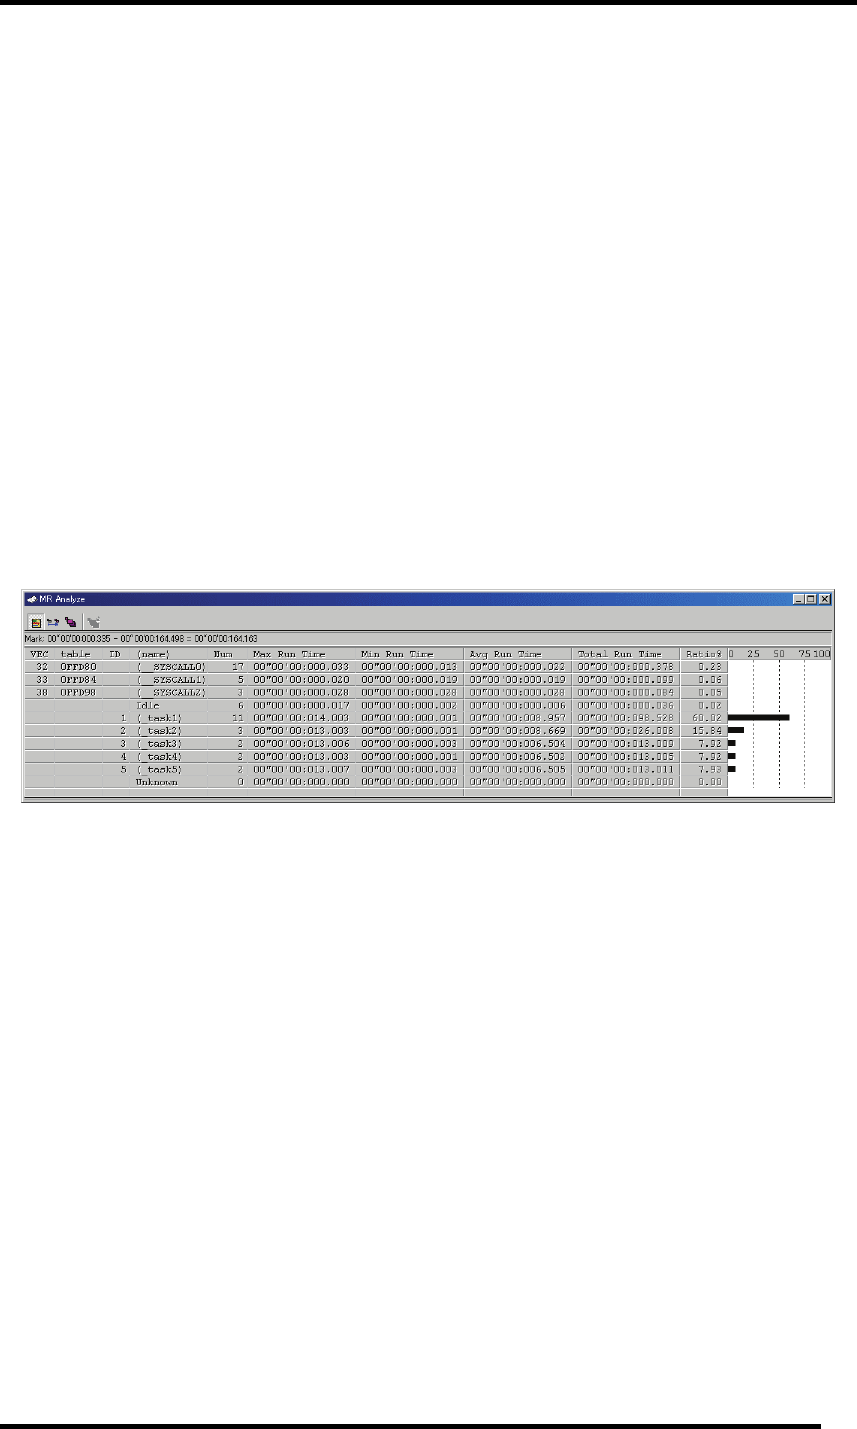
7.16.1 Configuration of CPU Occupancy Status Display Mode
The CPU occupation state display mode is used to display the CPU occupation time and ratio by
interrupt/task.
The MR Trace window shows the statistical results within the range specified by the start marker
and end marker.
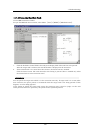
By clicking the maximum execution time/minimum execution time display area of each line, you can
search interrupt to the clicked line or process history at the maximum/minimum execution time of the
task.
The search result is pointed by the indicator which moves to the target position in the MR Trace
window.
218