


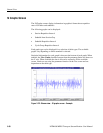
Stream View
3-54 MTM400 MPEG Transport Stream Monitor User Manual
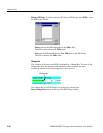
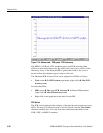
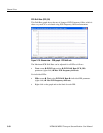
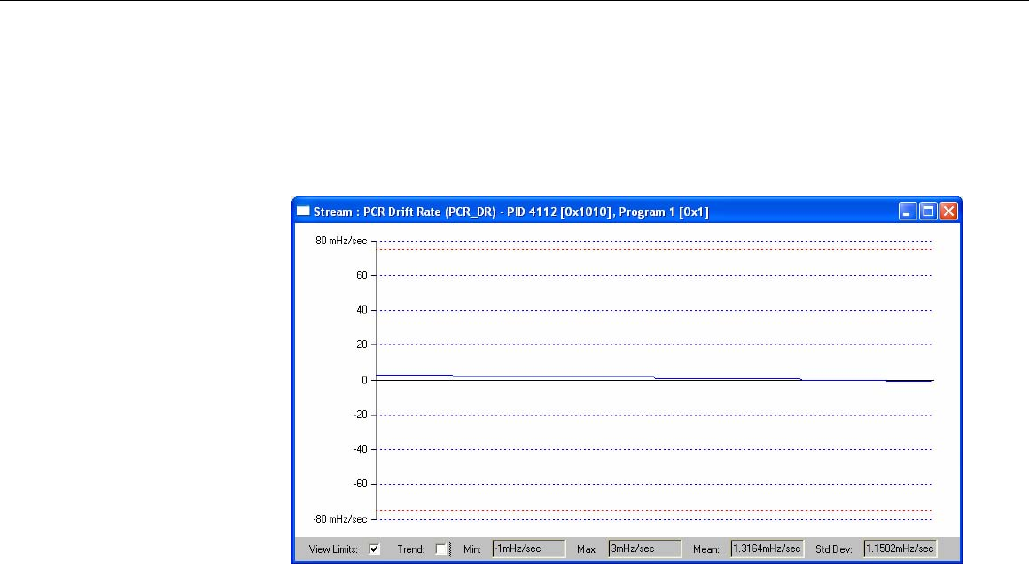
PCR Drift Rate (PCR_DR)
This Drift Rate graph shows the rate of change of PCR Frequency Offset, which is
often very small. It is calculated using PCR Frequency Offset measurements.
Figure 3-19: Stream view - PCR graph - PCR drift rate
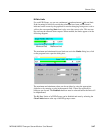
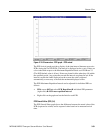
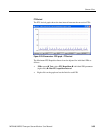
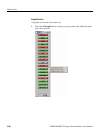
The Maximum PCR Drift Rate can be adjusted for all PIDs as follows:
Tests screen Î PCR Tests section Î PCR Drift Rate (PCR_DR)
parameter (right-click) Î Max PCR frequency drift rate.
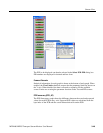
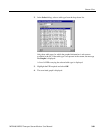
For individual PIDs:
PIDs screen Î Test: select PCR Drift Rate Î individual PID parameter
(right-click) Î Max PCR frequency drift rate.
Right-click on the graph and set the limit for each PID.