


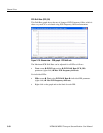
Stream View
3-58 MTM400 MPEG Transport Stream Monitor User Manual
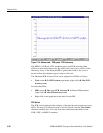
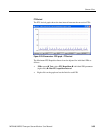
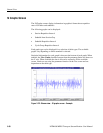
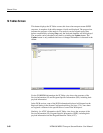
SI Graphs Screen
The SI Graphs screens display information in graphical format about repetition
rates of SI tables and subtables.
The following graphs can be displayed:
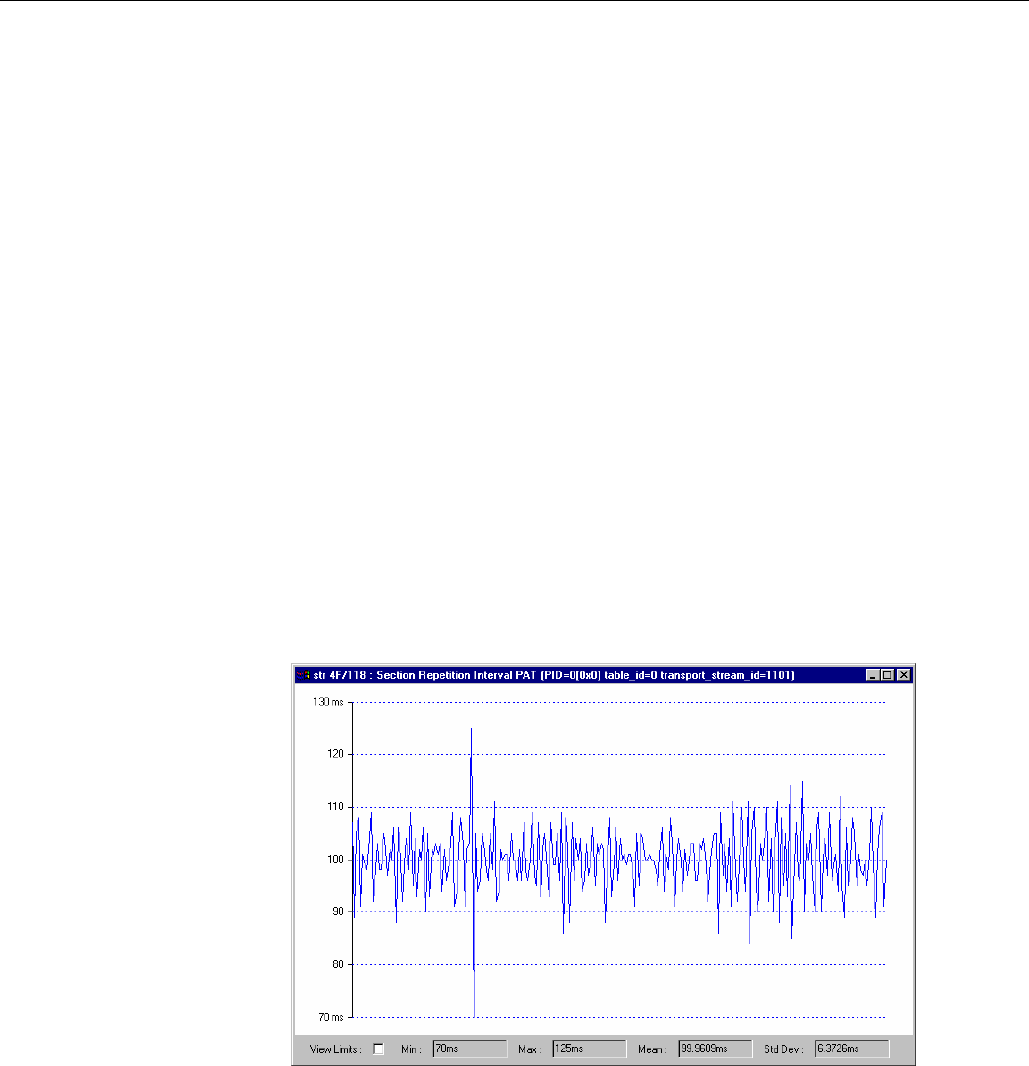
Section Repetition Interval
Subtable Inter Section Gap
Subtable Repetition Interval
Cycle Group Repetition Interval
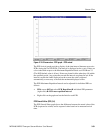
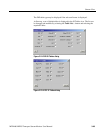
Each graph type can be displayed for a selection of table types. The available
graphs vary depending on which standard is selected.
Statistical information for each graph is shown at the bottom of each graph. When
enabled, the View Limits checkbox ensures that the parameter limits are shown on
the Y-axis. When disabled, the data is allowed to expand to fill the available
screen. Limits are set using the parameter function on the Test screen and are
dependent on the table type.
Figure 3-23: Stream view - SI graphs screen - Example