


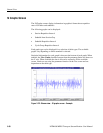
Stream View
MTM400 MPEG Transport Stream Monitor User Manual 3-55
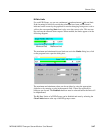
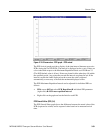
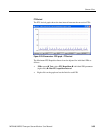
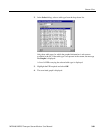
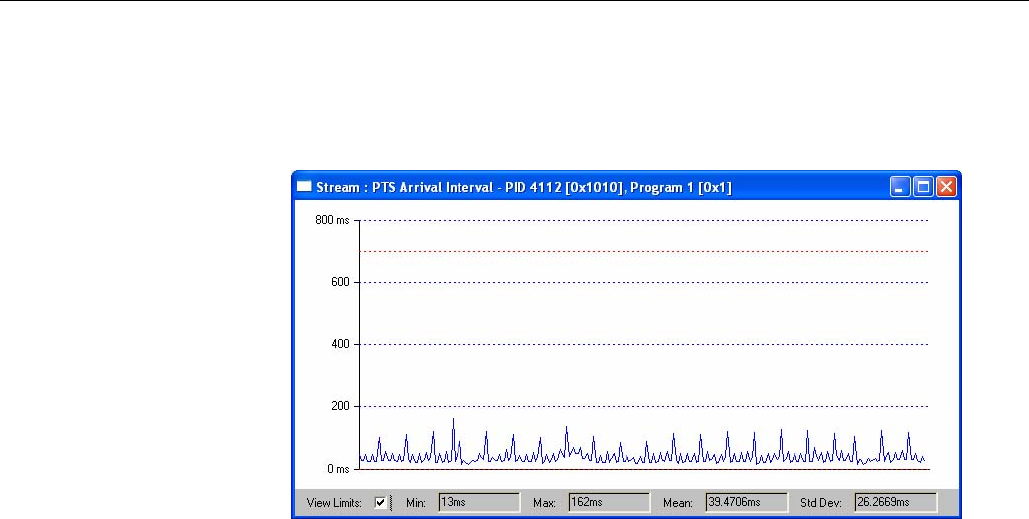
PTS Arrival
The PTS Arrival graph shows the time interval between the successive PTSs.
Figure 3-20: Stream view - PCR graph - PTS arrival
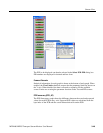
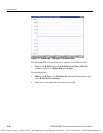
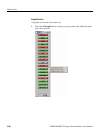
The Maximum PTS Repetition Interval can be adjusted for individual PIDs as
follows:
PIDs screen Î Test: select PTS Repetition Î individual PID parameter
(right-click) Î Max PTS repetition interval.
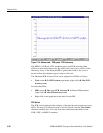
Right-click on the graph and set the limit for each PID.