Operating Basics
MTM400 MPEG Transport Stream Monitor User Manual 2-7
The information takes the form of a series of screens; a brief summary of each
follows:
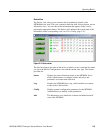
Summary A dynamic visual overview of the stream and monitoring status.
The information is updated at regular intervals.
(See page 3-20.)
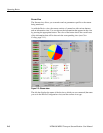
Detail Displays the detailed information about the stream according to
SI tables, PIDs, or Program.
(See page 3-22.)
Tests Displays the state of the tests applied to the stream. It also
allows users with read-write permissions (Administrators) to
configure alarms and relays and parameters associated with each
test.
(See page 3-23.)
Information
Displays events not normally logged in the Stream log; for
example, PAT/PMT version changes.
(See page 3-28.)
Custom Displays the state of the tests in the same way as the Tests view,
but categorized as Critical, Major, Minor or Warning.
The allocation of tests to categories is preconfigured, but you
can override the settings at run time. However, the settings will
not be saved when the RUI is closed (using the WebMSM
allows permanent configurations to be saved).
(See page 3-26.)
Programs Displays the programs that are being transmitted on the stream
along with bit rate and the minimum and maximum bit rates that
are observed. Administrators can set bit rate limits for each
program if the bit rate limits option is licensed.
(See page 3-30.)
PIDs Displays the PIDs that are being transmitted on the stream along
with bit rate and the minimum and maximum bit rates that are
observed. Administrators can set bit rate limits for each PID if
the bit rate limits option is licensed.
(See page 3-34.)
PID Groups * Displays the PID groups that you have created. The displayed
information includes the error state and the bit rate.
(See page 3-41.)


