


Operating Basics
MTM400 MPEG Transport Stream Monitor User Manual 2-11
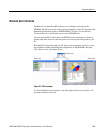
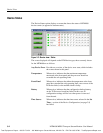
Color Coding
In the RUI Hot Spot View, the Device and Stream buttons use the color scheme
shown in Table 2-1.
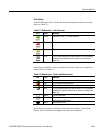
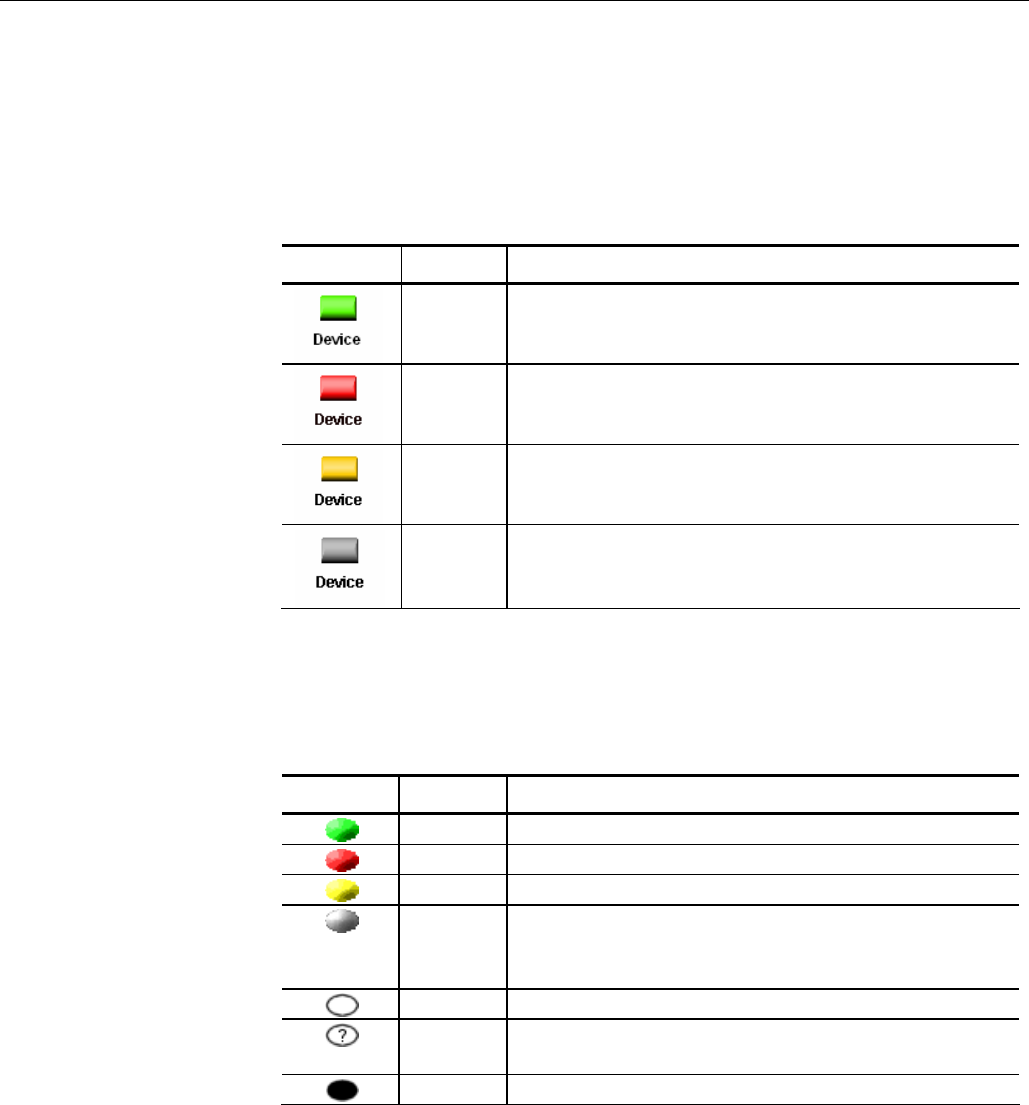
Table 2-1: Button colors - Hot Spot views
Icon Color Meaning
Green Operation normal — no error detected.
Red Error detected and still present.
Yellow Transient error, which has now corrected itself.
Gray The corresponding test has been disabled (or is unavailable).
All buttons gray indicates that connection to a device has
been lost.
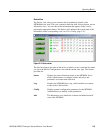
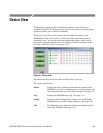
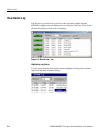
In the Stream and Device views, the buttons and icons use the color-coded error
scheme shown in Table 2-2.
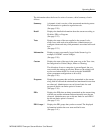
Table 2-2: Button colors - Device and Stream views
Icon Color Meaning
Green Operation normal — no error detected.
Red Error detected and still present.
Yellow Transient error, which has now corrected itself.
Gray The corresponding test has been disabled (or is unavailable).
All buttons are gray indicates that connection to a device has
been lost.
White Test not applicable.
Clear / ? Test unknown or incomplete (for example, during a
measurement settling time).
Black Maintenance mode.
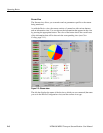
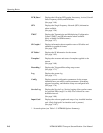
Where buttons represent a collection of elements (for example, for the Status
button), the color indicates the highest error state of the elements.