


4-32
Cisco uBR7225VXR Universal Broadband Router Hardware Installation Guide
OL-17309-02
Chapter 4 Connecting the Cisco uBR7225VXR Router to the Cable Headend
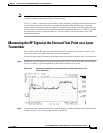
Measuring the Upstream RF Signal
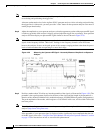
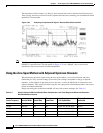
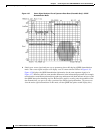
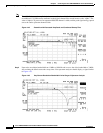
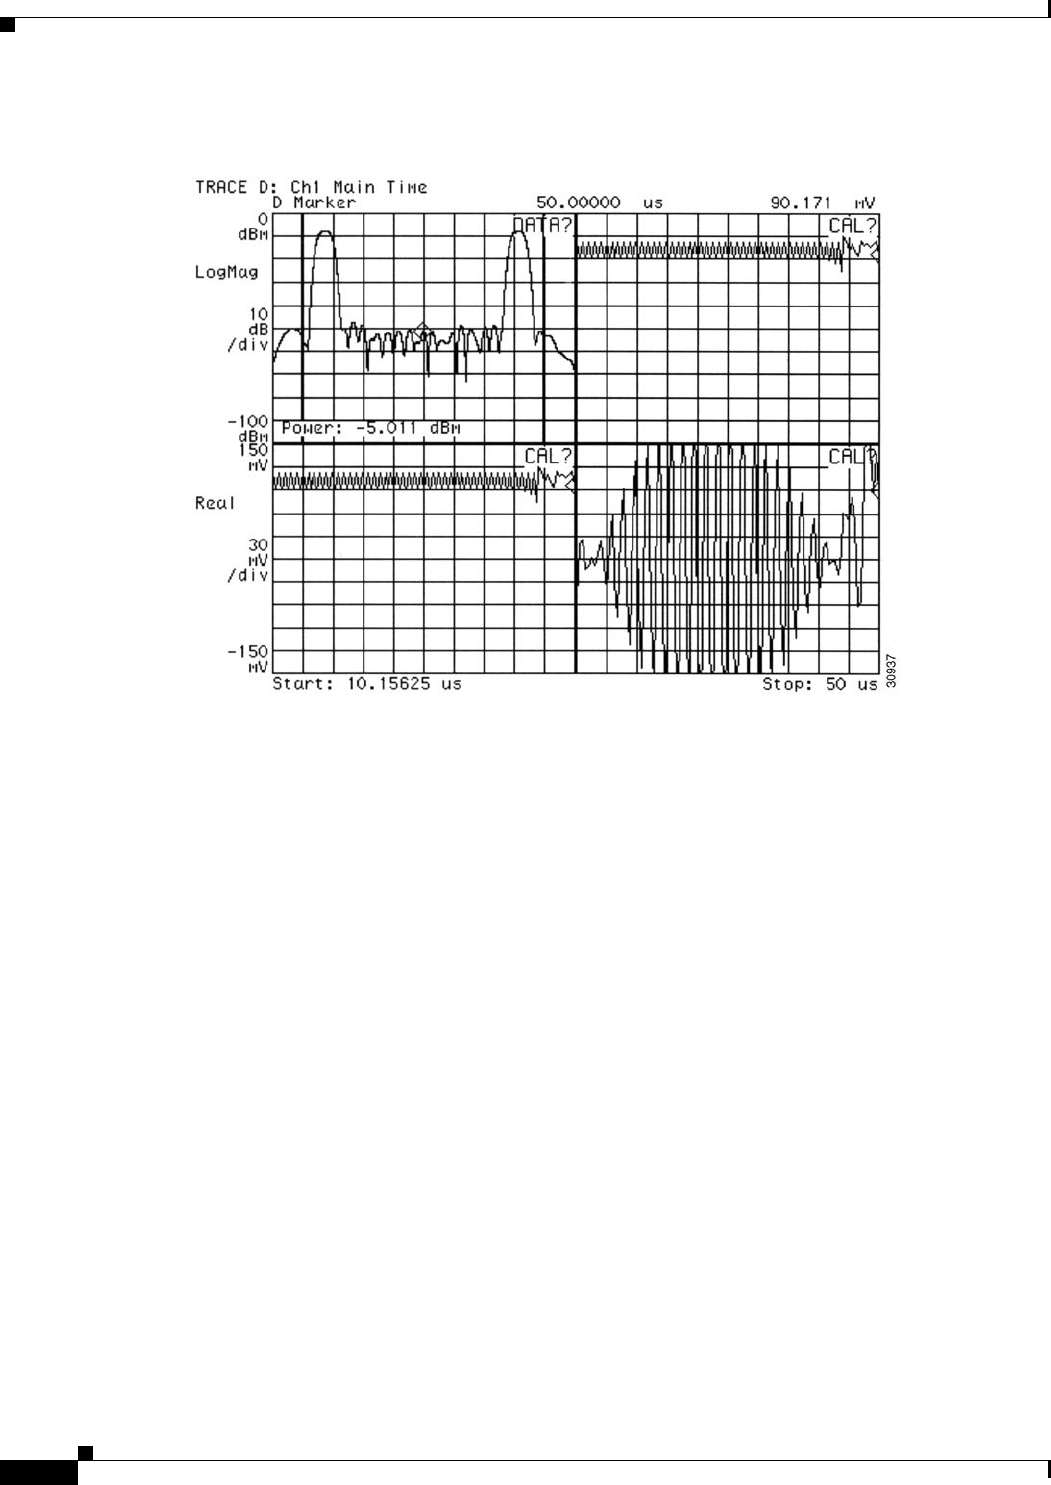
Figure 4-37 Vector Signal Analyzer Plot of Upstream Data Burst (Preamble Only)—QPSK
Demodulation Mode
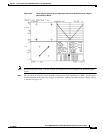
d. Switch your vector signal analyzer over to quaternary phase shift keying (QPSK) demodulation
mode. Your vector signal analyzer will display a set of screens similar to those in Figure 4-38.
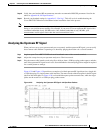
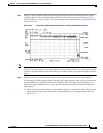
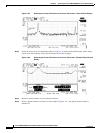
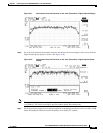
Figure 4-38 displays the QPSK demodulation information for the same upstream signal as in
Figure 4-37. However, there are some notable differences in the information presented. For example,
notice that the constellation and transition graphs (top and bottom left) both indicate only two of the
four QPSK data points handling any bits. Because this graph is covering only the preamble of the
data transmission, you get to see only a portion of the whole signal performance. (If you were to
view the entire signal transmission in this mode, all four QPSK data points would display bits.)