


4-29
Cisco uBR7225VXR Universal Broadband Router Hardware Installation Guide
OL-17309-02
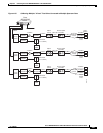
Chapter 4 Connecting the Cisco uBR7225VXR Router to the Cable Headend
Measuring the Upstream RF Signal
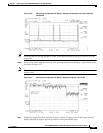
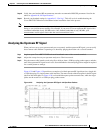
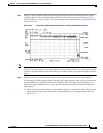
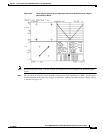
Step 1 Display a signal complete with preamble and upstream data transmission information similar to the
resulting signal from Step 3 through Step 10 under the “Measuring the Upstream RF Signal Using a
Spectrum Analyzer” section on page 4-22. Your spectrum analyzer should display a signal similar to the
one in Figure 4-34.
Figure 4-34 Preamble Amplitude Before Resolution and Video Bandwidth Reduction
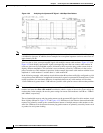
Note Figure 4-34 is a display from a standard spectrum analyzer. The following figures, Figure 4-35 through
Figure 4-38, are taken from a vector signal analyzer. If you do not have access to a vector signal analyzer,
or want to skip the following section describing its use when viewing your upstream signal, proceed to
Step 3.
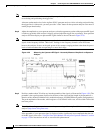
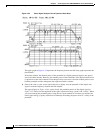
Step 2 (Optional) View your upstream signal using a vector signal analyzer such as the Agilent 89441A.
The advantage of displaying these signals with the vector signal analyzer is that you can view them over
the time domain for a specified time interval. In addition, the vector signal analyzer enables you to
measure the digital channel power of a very short duration data transmission, like the preamble of a
digital signal.
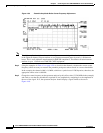
a. Set up your vector signal analyzer to view both the “frequency” domain and “time” domain of your
upstream signal. Your vector signal analyzer should display a pair of signals similar to those in
Figure 4-35.