


4-14
Cisco uBR7225VXR Universal Broadband Router Hardware Installation Guide
OL-17309-02
Chapter 4 Connecting the Cisco uBR7225VXR Router to the Cable Headend
Measuring the Downstream RF Signal
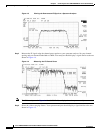
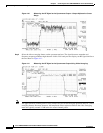
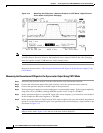
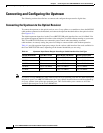
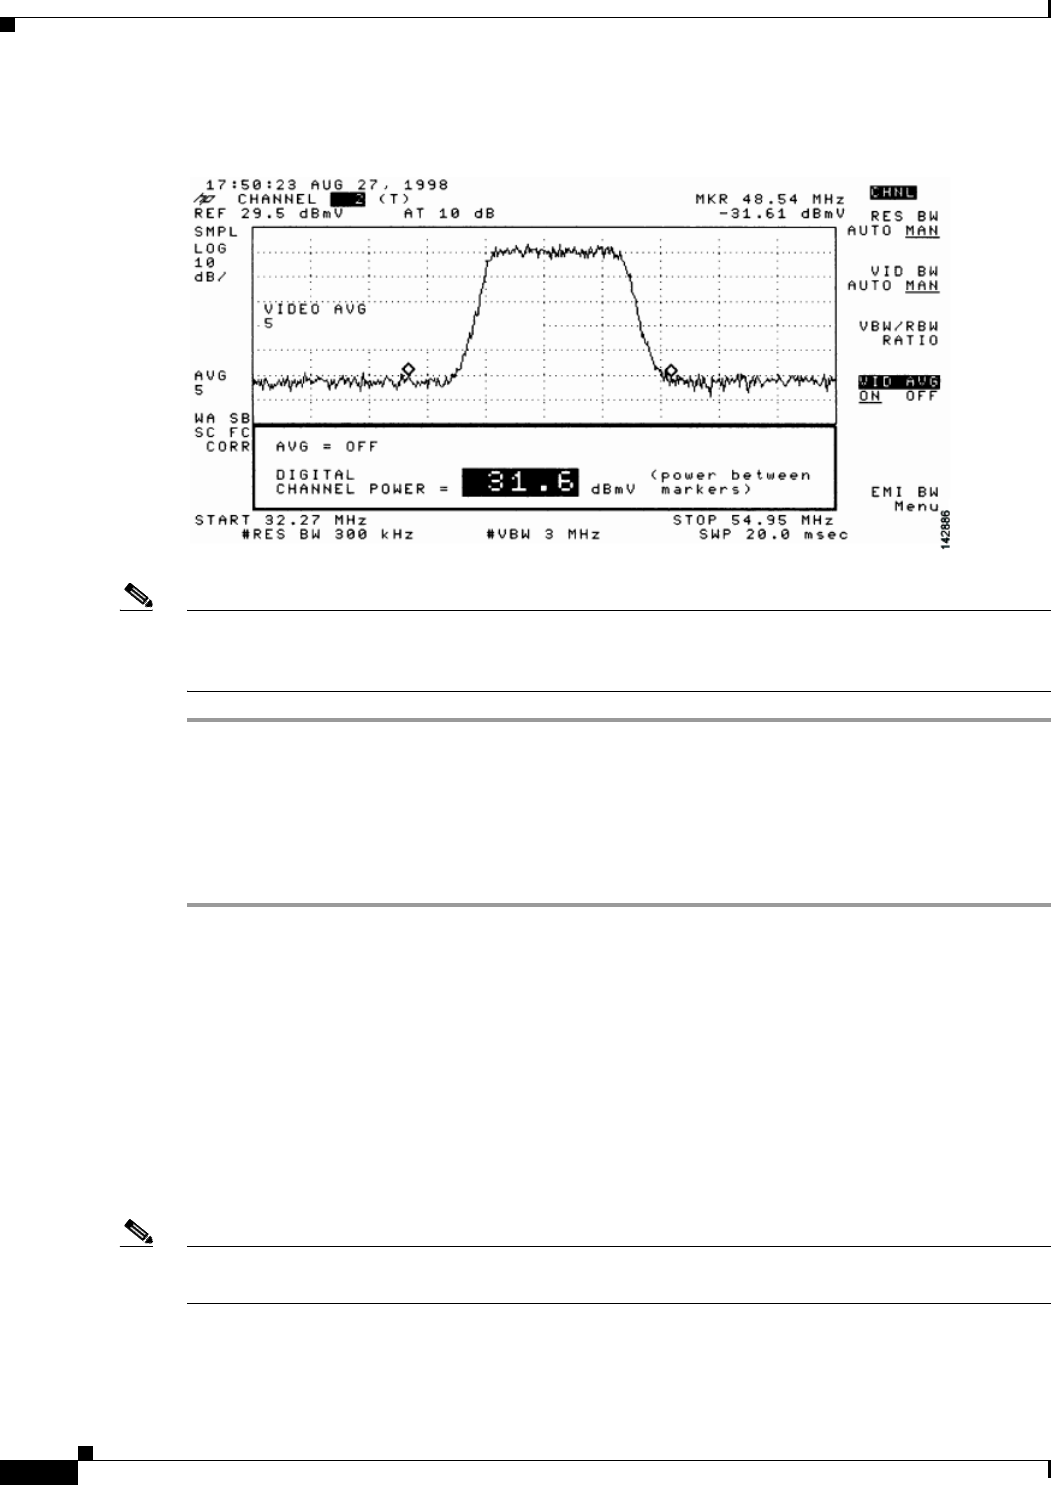
Figure 4-16 Measuring the IF Signal on a Spectrum Analyzer in CATV Mode—Digital Channel
Power Screen (Using Video Averaging)
Note The approximate in-channel peak-to-valley flatness can be verified using the spectrum analyzer’s video
averaging feature. Be aware, however, that amplitude values registered while in the video averaging
mode are typically around 2.5 dB below the actual channel power.
Proceed to the next section, “Measuring the Downstream RF Signal at the Upconverter Output Using
CATV Mode.”
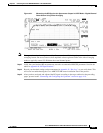
Measuring the Downstream RF Signal at the Upconverter Output Using CATV Mode
Step 1 Disconnect the spectrum analyzer from the cable interface card downstream connector.
Step 2 Connect the downstream output of the cable interface card to the upconverter input connector.
Step 3 Connect the spectrum analyzer to the RF output of the upconverter.
Step 4 Set the upconverter output level to the manufacturer’s recommended settings. Typical output amplitudes
range from +50 to +58 dBmV, although DOCSIS specifies levels as high as +61 dBmV.
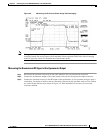
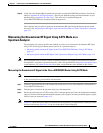
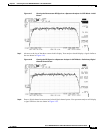
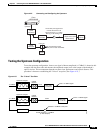
Step 5 Set the spectrum analyzer to view the RF signal at the center frequency you selected for your headend.
In this example, the RF center frequency is 705 MHz.
Step 6 Set the spectrum analyzer to CATV mode (CATV analyzer option) and select the channel measurement
option to view the downstream RF signal. Your spectrum analyzer should display a signal similar to the
one shown in Figure 4-12.
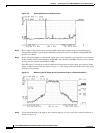
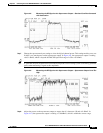
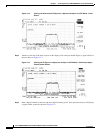
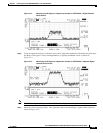
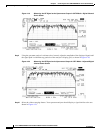
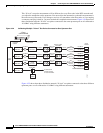
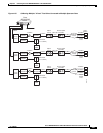
Note Figure 4-17 shows the first of three screens that will be displayed by an Agilent 8591C when you use the
analyzer in this mode. Figure 4-18 is the last of the three screens displayed.