


VTS Data Flow
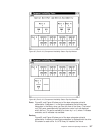
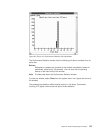
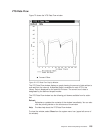
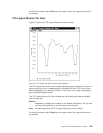
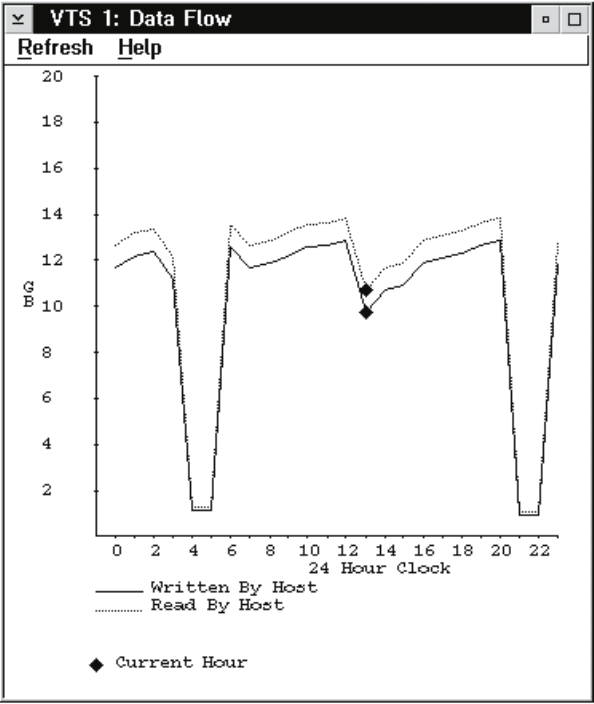
Figure 72 shows the VTS Data Flow window.
The VTS Data Flow window displays a graph showing the amount of data written to
and read from the channel. A separate graph is available for each VTS in the
Library. Data is displayed for the previous 24 hours. The current hour’s data is
designated by the diamond shaped marker.
The VTS Data Flow window has the following pull-downs available from its action
bar:
Refresh
Refreshes or updates the contents of the window immediately. You can also
click the pointing device on the client area of the window.
Help Provides help about the VTS Data Flow window.
To close the window, select Close from the system menu icon (upper-left corner of
the window).
Figure 72. VTS Data Flow Pop-Up Window
Chapter 6. Advanced Operating Procedures 125