


Chapter 2 New Features in LabVIEW 5.1
©
National Instruments Corporation 2-15 LabVIEW 5.1 Addendum
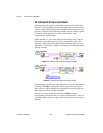
HiQ and MATLAB Functionality for Windows
HiQ and MATLAB are software packages that help you organize and
visualize real-world math, science, and engineering problems. You can
use HiQ and MATLAB to express numeric formulas elegantly. Now with
LabVIEW you can load and edit HiQ and MATLAB scripts into your block
diagram code so LabVIEW works with their advanced mathematics
functionality.
Note
You must have HiQ 4.1 or MATLAB 5.0 or later installed to use this new feature
successfully. You can install HiQ 4.1 from the LabVIEW CD-ROM. HiQ and
MATLAB functionality is available for Windows only in the LabVIEW Full
Development System and Professional Development System.
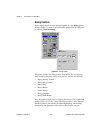
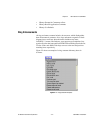
There is a new script node that works similarly to the formula node.
You can find a HiQ script node and a MATLAB script node in the
Functions»Mathematics»Formula palette. You can place a script node
on your block diagram and enter a script according to the syntax of HiQ or
MATLAB. LabVIEW then communicates with that script server engine for
you. When you create inputs and outputs on the script node, those values
are passed between HiQ or MATLAB and LabVIEW. If you already have a
script written, you can import it from HiQ or MATLAB. See the section
Importing or Exporting a Script for more information.
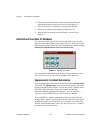
Although the basic functionality of the script node is similar to that of the
formula node, the script node can handle more datatypes than the formula
node. This script node supports the same HiQ or MATLAB datatypes as
supported by ActiveX.
Note
Because of the nature of the HiQ and MATLAB script languages, you must choose
which LabVIEW datatype each terminal should be. For more information, see the
section Configuring the Datatype of a Terminal, later in this chapter.
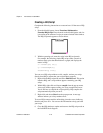
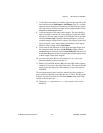
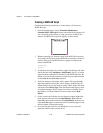
The following two sections, Creating a HiQ Script and Creating a
MATLAB Script, contain procedures for creating a script that does the
following:
1. Generates a matrix of random values
2. Plots that information to a graph
3. Displays the graph in either product
4. Presents the generated random values on your front panel in LabVIEW