


Chapter 2 New Features in LabVIEW 5.1
LabVIEW 5.1 Addendum 2-24
©
National Instruments Corporation
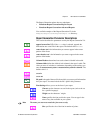
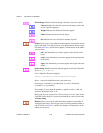
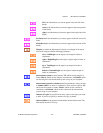
Signal Processing Palette
For function and reference information about the Signal Processing VIs,
refer to the Signal Processing VIs topic in the LabVIEW Online Reference.
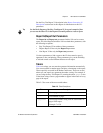
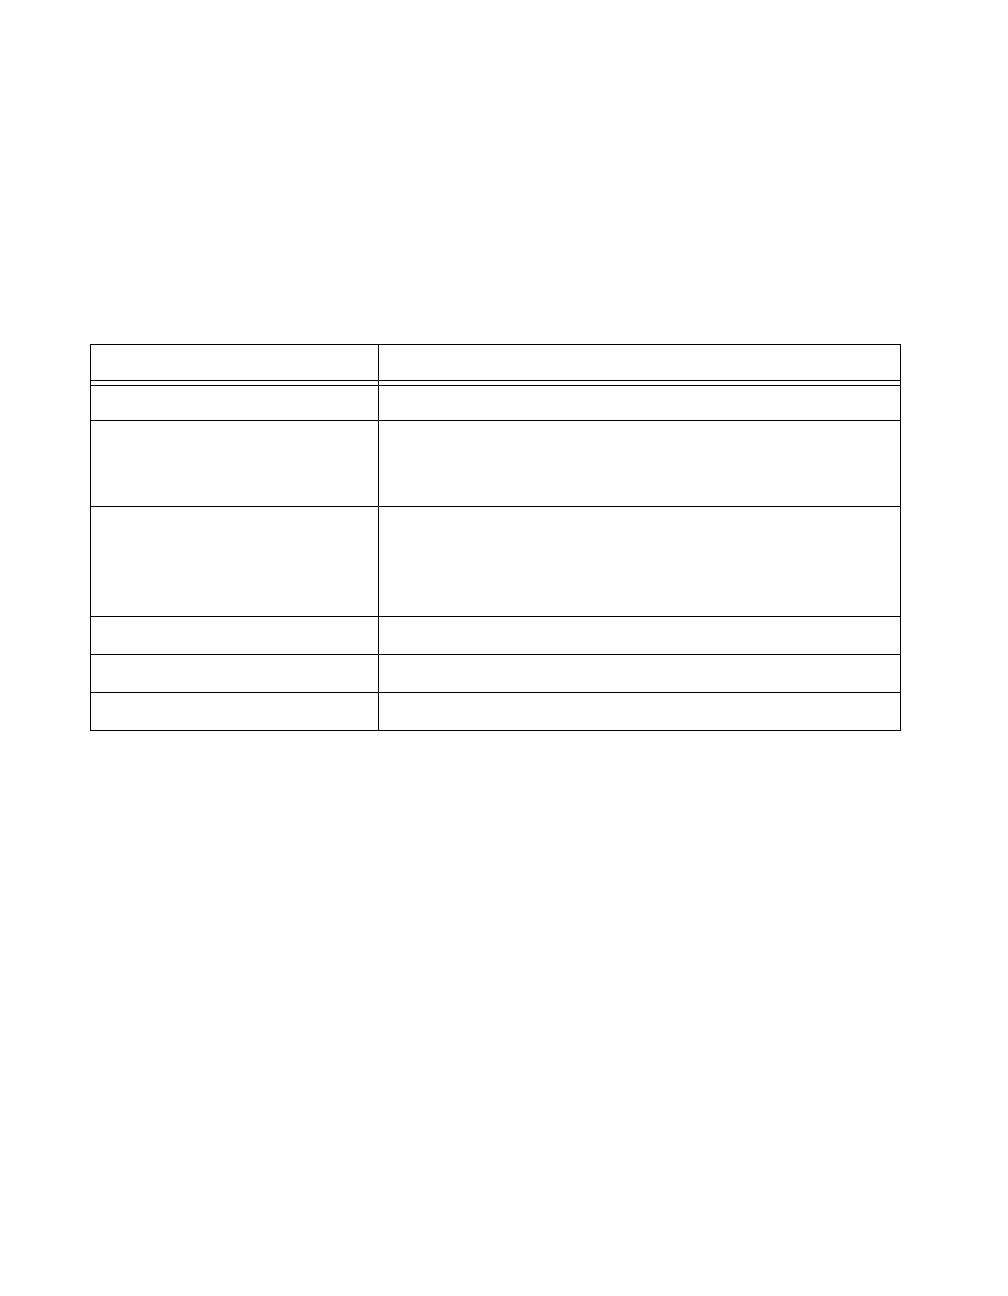
Table 2-4 lists the subpalettes you find in the Functions»Signal
Processing palette, and lists the previous location of the VIs or functions in
LabVIEW 5.0.
You can find examples of the Signal Processing VIs in the
Examples\Math\sig_proc.llb directory.
Integration of the Picture Control VIs
With LabVIEW 5.1, you can display complex images and graphs using
functionality that previously was included only in the Picture Control
Toolkit. Because the Picture Control Toolkit has been integrated into the
LabVIEW Full Development System, you can use any of the VIs in the
Picture Control VI Library. The Picture Control VIs include drawing
operations you can use to create diagrams and build images dynamically.
You can create new front panel displays such as specialized bar graphs, pie
charts, or Smith charts. You also can display and animate arbitrary objects
such as robot arms, test equipment, or a two-dimensional display of a
real-world process. For detailed information about these VIs, refer to the
Graphics and Sound VIs topic in the LabVIEW Online Reference.
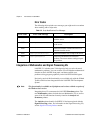
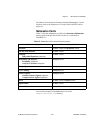
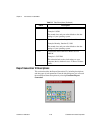
Table 2-4.
Signal Processing VIs Current and Previous Locations
Signal Processing Subpalettes Previously Located in...
Signal Generation Analysis palette
Time Domain Analysis palette
(These functions were found in the Analysis palette’s Signal
Processing subpalette)
Frequency Domain Analysis palette and G Math Toolkit
(Combines the FFT and Power Spectrum VIs found in the
Analysis palette’s Signal Processing subpalette and the VIs
found in the G Math Toolkit’s Transforms palette.)
Measurement Analysis palette
Filters Analysis palette
Windows Analysis palette