


Graphics 5–15
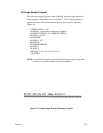
P–Series Plot Mode
P–Series compatible Odd/Even Dot Plot mode is only available in P–Series
printer protocol. Since plot mode can address and print any individual dot
position, it is possible to produce a variety of graphics, including bar codes,
complex curve graphs, pie and bar charts, block characters, or halftones.
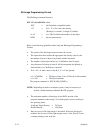
Plot Density
Plot density refers to the number of dots per inch (dpi) printed in a single dot
row. There are two types of plot density available with P–Series Plot mode
graphics: normal density and double density.
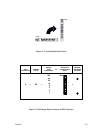
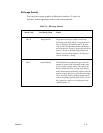
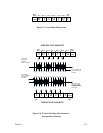
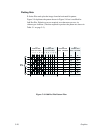
Normal Density Plot Characteristics
Based on the mode of operation, the odd–numbered dot columns produce a
horizontal and vertical density that varies. The following table shows the
horizontal dpi and vertical dpi for the corresponding print mode. Figure 5–5
illustrates normal density dot plot.
NOTE: Different print modes cannot be mixed on the same dot row.
Print
Mode
Horizontal dpi Vertical dpi
Correspondence (NLQ)
90 96
Data Processing (DP) 60 72
High Speed (HS) 62.5 64
Barcode 145
72.5 72*
Barcode 160
80 72*
*If Configuration Option 59.0 is set to 59.1 (refer to page 4–38).
Figure 5–5. Normal Density Plot