Graphics5–2
Introduction
MVP–Series printers can produce bit image graphics in two modes: Raster
Plot Mode and Bit Image Plot Mode. Both outputs are printed a dot row at a
time, from top to bottom. The major difference between the two methods is
the way the software manipulates the received data before output.
Raster plotting prints horizontal dot patterns corresponding to stored ASCII
character code true or 1 bits. In bit image plotting, the stored code prints in
vertical dot patterns because the print wires are arranged vertically.
P–Series compatible Odd/Even Dot Plot mode is only available in P–Series
printer protocol. Since plot mode can address and print any individual dot
position, it is possible to produce a variety of graphics, including bar codes,
complex curve graphs, pie and bar charts, block characters, or halftones.
To initiate special plotting features use the appropriate control sequences
described in following sections. Some control sequences require that the
software contain configuration options, coordinated with specific control
codes, before they can provide the desired printer output.
Raster Plotting
Raster plot data is sent to the printer as “printable” ASCII characters. Each
printable ASCII character has seven–bit binary code associated with it. There
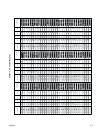
are 96 printable ASCII characters (see Table 5–1), starting with SP (space)
decimal code 32, through DEL (delete) decimal code 127. Included in the set
are the ten digits (0–9), the upper and lower case alphabet (A–Z and a–z) and
the various punctuation and other characters normally available on a standard
keyboard.
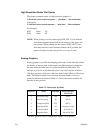
Dot patterns obtained using the raster plotting feature correspond to the least
significant six bits of each seven–bit code. That is, a dot is typed for every bit
set (every “1”) in the ASCII code, except the seventh, or most significant bit.
The dot pattern progresses from left to right with the leftmost dot set by the
least significant bit (LSB).


