


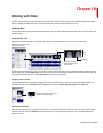
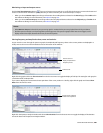
Monitoring an input and output source
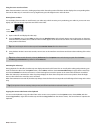
Click the Real Time Monitoring button ( ) to turn real-time spectrum analysis on or off. Click the down arrow next to the button and
choose a command from the menu to specify whether you want to monitor your sound card’s input or output:
• When you choose Monitor Input, Sound Forge will monitor the recording devices selected on the Record page of the Audio tab in
the Preferences dialog. For more information, see Audio tab on page 322.
• When you choose Monitor Output, Sound Forge will monitor the playback devices selected on the Playback page of Audio tab in
the Preferences dialog. For more information, see Audio tab on page 322.
Notes:
• When Monitor: Output is selected, the post-processing signal is monitored when you start playback from the Plug-In Chainer.
• Real-time spectrum analysis can require significant processing power. If the spectrum graph’s refresh rate seems sluggish, set the
display mode to Line Graph, decrease the FFT size, or turn off snapshots.
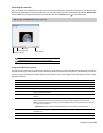
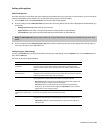
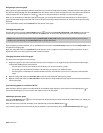
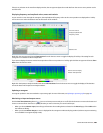
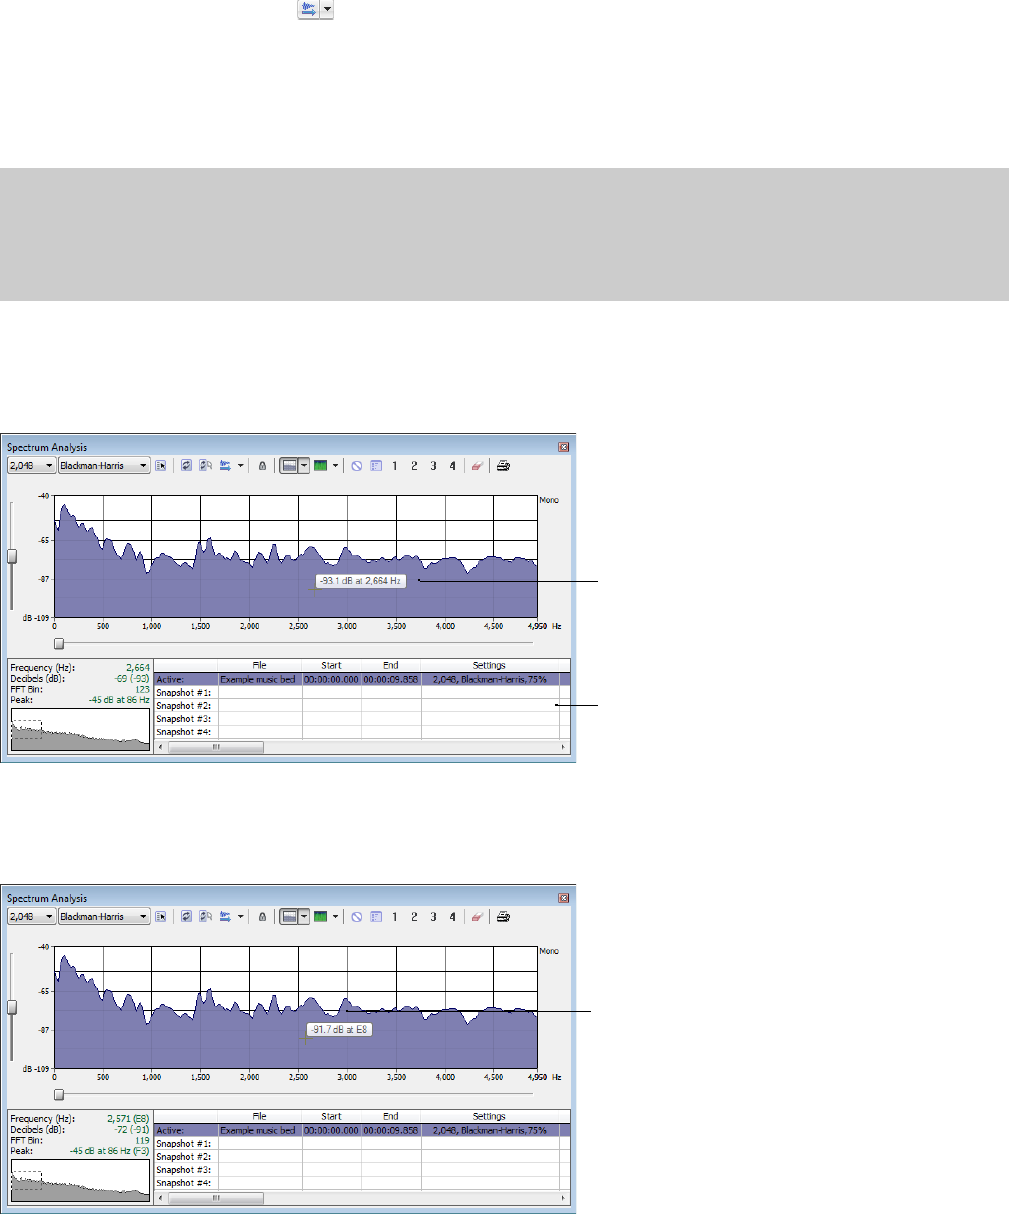
Viewing frequency and amplitude values, notes and statistics
As you move the cursor through the spectrum graph, the amplitude and frequency values at the current position are displayed in a
ToolTip next to the cursor and in the Statistics area at the bottom of the window:
Use the cursor to
display amplitude and
frequency values
Statistics area
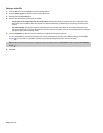
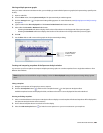
Right-click the graph and choose Show Position from the shortcut menu to toggle the display of ToolTips. The setting for each graph in
a multichannel file is independent.
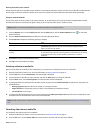
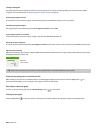
If you want to display the nearest musical note equivalent of the cursor position in a ToolTip, right-click the graph and choose Show
Notes from the shortcut menu:
Use the cursor to display
musical note equivalent
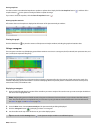
Right-click the Spectrum Analysis window and choose Show Statistics from the shortcut menu to toggle the display of the Statistics
area at the bottom of the Spectrum Analysis window.
USING SPECTRUM ANALYSIS | 281