


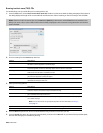
Tuning a sonogram
It is frequently necessary to experiment with the control parameters in the Spectrum Settings dialog to produce the best possible
sonogram. For more information, see Adjusting Spectrum Analysis settings on page 287.
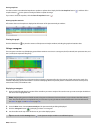
Improving the graph’s contrast
To improve the contrast of the sonogram, decrease the frequency and amplitude ranges as much as possible.
Smoothing the graph’s display
If the graph appears too pixelated, raise the Set sonogram resolution value to 200.
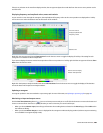
Improving the frequency resolution
For greater frequency resolution, choose a higher value from the FFT size drop-down list.
Reducing the processing time
To reduce processing time, decrease the Set sonogram resolution value and/or choose a lower value from the FFT size drop-down list.
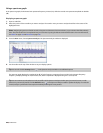
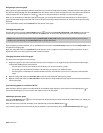
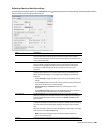
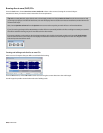
Adjusting color intensity
Adjust the sonogram’s color intensity using the Color slider located directly beneath the sonogram. Notice that the bottom pane of the
dialog depicts the color scale in dB.
Adjust the
color intensity
Tip:
This function may be fairly slow if you do not have a palletized driver or if Video for Windows is not installed.
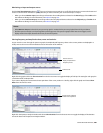
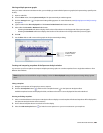
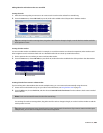
Synchronizing sonograms in a multichannel file
When viewing a sonogram for a multichannel file, an individual graph displays for each channel. Click the Sync button ( ) to
synchronize the displays so you can view the same region of the FFT in all channels.
Returning to a spectrum graph
To return to the spectrum graph, click the Normal Display button ( ) in the toolbar.
Printing the sonogram
Click the Print button ( ) to print the contents of the Spectrum Analysis window, including the sonogram and statistics data.
286
| CHAPTER 19